Report Studio : JavaScript Samples
Here's a collection of all JavaScript Articles that can be found in this blog:
1.Removing Parameter Name from Value Prompts
2.Implementing Default Date Prompt Scenario in Report Pages using Javascript and Render Variable Concept
3.Set Font for Date Prompts using JavaScript
4.JavaScript for Date Validation
5.Default Date Prompts to Current Date and Current Date - 30 days
6.JavaScript to Deselect Value Prompt Box Selections
7.Expand / Collapse Javascript
8.My First Fusion Chart
9.Hide/Display Drill Through Links based on Levels
10.Default Date Prompts to Current Date and Current Date - 30 days
11.Tree Prompt on Relational Models using Prompt API
12.Autosubmit Cognos prompt page using java script.
13.Hide tool bar in cognos viewer
14.Hide excel/xml/csv output options in cognos viewer using java script
1.Removing Parameter Name from Value Prompts
This has been covered in numerous mails, sites and posts. I am including the same here for the benefit of those who visit and use the site for all their JavaScript needs.
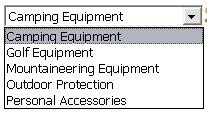
By default Single Select Value Prompts, display the Query Item Name as the first item in the drop down and the second item is a dotted line.

To remove the first 2 lines of value prompts follow the steps below:
Name the value prompt as PL.
Insert an HTML item below the prompt and include the below script:
<script>
var fW = (typeof getFormWarpRequest == "function" ?getFormWarpRequest() : document.forms["formWarpRequest"]);
if ( !fW || fW == undefined)
{ fW = ( formWarpRequest_THIS_ ?formWarpRequest_THIS_ : formWarpRequest_NS_ );
}
var objProductLine = fW._oLstChoicesPL;
objProductLine .remove(1);
objProductLine .remove(0);
objProductLine .removeAttribute('hasLabel');
</script>
The first 2 lines in the value prompt are now removed.

Note: This technique uses JavaScript against underlying report objects in a IBM Cognos 8 BI report. For this reason, there is no guarantee that reports created using this technique will migrate or upgrade successfully to future versions without requiring modifications. Any such modifications are the responsibility of the report designer.
2.Default Date Prompt Scenario in Report Pages using Javascript and Render Variable Concept
Do you need to implement Date prompts in report pages without using macros? Then here is the solution using Render Variable. Remember a date prompt will always have a value (current date by default) and default selections cannot be dynamic values. They need to be static dates.
Requirement: Display Year, Retailer, Order Method, Revenue, Gross Profit for default date of current date - 30 days to current date.
Solution:
Step 1: Create basic list report using GO Sales package by dragging the required data items from the package.
Step 2: Create 2 Date prompts called From Date and To Date and name the prompts as FromDate and ToDate for referencing in JavaScript and include a Finish Prompt button.
Step 3: Create a filter in your query as [Date] between ?From Date? and ?To Date? and set it to required.
Step 4: Let us call this list and query as "Date Prompts Selected".

Step 5: Now to handle the default scenario. Copy paste the "Date Prompts Selected" list and query and name them as "Date prompts Default".


Step 6: Create a String Conditional Variable called "Date Prompt Values" with the following condition:
case when paramcount('From Date') = 0 then 'Date prompts Default' else 'Date prompts Selected' end
Step 7: Apply the conditional variable to the render variable property of the "Date Prompts Selected" list and "Date prompts Default" list.
Step 8: Now to implement the Current Date - 30 to Current Date scenario in the "Date prompts Default" query, modify the filter to:
[Date] between _add_days(current_date, - 30) and current_date
Step 9: To implement the Current Date - 30 to Current Date scenario in the Date Prompts using JavaScript:
Insert a text box prompt to identify the default run of the report. Name this as RunValue. Set the default selection to 1 to identify this as Run 1. Set the Visible property of this object to No.

Now insert an HTML Item below the prompts and insert the following script:
<script type="text/javascript">
function DefaultDateSelection()
{
var fW = (typeof getFormWarpRequest == "function" ?getFormWarpRequest() : document.forms["formWarpRequest"]);
if ( !fW || fW == undefined)
{ fW = ( formWarpRequest_THIS_ ?formWarpRequest_THIS_ : formWarpRequest_NS_ );
}
var months = new Array('Jan','Feb','Mar','Apr','May','Jun','Jul','Aug','Sep','Oct','Nov','Dec');
var RunValueObj = fW._textEditBoxRunValue;
if(RunValueObj.value==1)
{
var ToTime=new Date();
var ToMonth=months[ToTime.getMonth()];
var ToDate= ToTime.getDate();
var ToYear= ToTime.getUTCFullYear();
var ToDate = ToMonth + ' ' + ToDate + ', ' + ToYear;
var FromTime = ToTime;
FromTime.setDate(FromTime.getDate()-30);
var FromMonth=months[FromTime.getMonth()];
var FromDate= FromTime.getDate();
var FromYear= FromTime.getUTCFullYear();
var FromDate = FromMonth + ' ' + FromDate + ', ' + FromYear;
pickerControlFromDate.setValue(FromDate);
pickerControlToDate.setValue(ToDate);
RunValueObj.value=2;
}
}
DefaultDateSelection();
</script>
Note: This technique uses JavaScript against underlying report objects in a IBM Cognos 8 BI report. For this reason, there is no guarantee that reports created using this technique will migrate or upgrade successfully to future versions without requiring modifications. Any such modifications are the responsibility of the report designer.
3.Set Font for Date Prompts using JavaScript
Have you ever wondered how to set the font for a date prompt. Date prompts provided by Cognos do not have a Font property. Whe you design report prompt pages and set the font for all other objects and if you have date prompts for which Font is not set, it sticks out in your prompt page (if you know what I mean).
So here is a small script to help set the Font.
where the date prompt is named as FromDate.
So here is a small script to help set the Font.
<script>
var fW = (typeof getFormWarpRequest == "function" ?getFormWarpRequest() : document.forms["formWarpRequest"]);
if ( !fW || fW == undefined)
{ fW = ( formWarpRequest_THIS_ ?formWarpRequest_THIS_ : formWarpRequest_NS_ );
}
var FromDateTextBox = fW.txtDateFromDate;
FromDateTextBox.style.fontFamily = 'Arial';
FromDateTextBox.style.fontSize = '8pt';
</script>
where the date prompt is named as FromDate.
Note: This technique uses JavaScript against underlying report objects in a IBM Cognos 8 BI report. For this reason, there is no guarantee that reports created using this technique will migrate or upgrade successfully to future versions without requiring modifications. Any such modifications are the responsibility of the report designer.
4.JavaScript for Date Validation
I keep receiving a lot of requests for Date Validation Javascript, thought I would share the same. Though this information is available on millions of sites, thought this could be of some use to all those who use this blog often.
Step 1: Drag 2 Date Prompts into the prompt page
Step 2: Name the Date Prompts as FromDate and ToDate
Step 3: Drag an HTML Item below the prompts and include the below script:
Step 4: Drag another HTML Item to create the prompt button. The onclick event of the button will trigger the date validation function.
Step 5: Drag a Prompt Button - Finish to enable the submission of the prompt page and hide the button by seting the height and width to 0px.
Step 1: Drag 2 Date Prompts into the prompt page
Step 2: Name the Date Prompts as FromDate and ToDate
Step 3: Drag an HTML Item below the prompts and include the below script:
<script type="text/javascript">
function validateDate()
{
var fW = (typeof getFormWarpRequest == "function" ?getFormWarpRequest() : document.forms["formWarpRequest"]);
if ( !fW || fW == undefined)
{ fW = ( formWarpRequest_THIS_ ?formWarpRequest_THIS_ : formWarpRequest_NS_ );
}
var FromDate = fW.txtDateFromDate.value;
var ToDate = fW.txtDateToDate.value;
if(FromDate > ToDate)
{alert('From Date is greater than To Date');}
else
{promptAction('finish');}
}
</script>
Step 4: Drag another HTML Item to create the prompt button. The onclick event of the button will trigger the date validation function.
<input type=button onclick='validateDate()' value='Finish'>
Step 5: Drag a Prompt Button - Finish to enable the submission of the prompt page and hide the button by seting the height and width to 0px.
Note: This technique uses JavaScript against underlying report objects in a IBM Cognos 8 BI report. For this reason, there is no guarantee that reports created using this technique will migrate or upgrade successfully to future versions without requiring modifications. Any such modifications are the responsibility of the report designer.
5.Default Date Prompts to Current Date and Current Date - 30 days
Step 1: Name the Date prompts as FromDate and ToDate.
Step 2: Drag an HTML Item into the report just below the Value Prompt and insert the below script into the same:
Step 2: Drag an HTML Item into the report just below the Value Prompt and insert the below script into the same:
<script type="text/javascript">
function DefaultDateSelection()
{
var fW = (typeof getFormWarpRequest == "function" ?getFormWarpRequest() : document.forms["formWarpRequest"]);
if ( !fW || fW == undefined)
{ fW = ( formWarpRequest_THIS_ ?formWarpRequest_THIS_ : formWarpRequest_NS_ );
}
var months = new Array('Jan','Feb','Mar','Apr','May','Jun','Jul','Aug','Sep','Oct','Nov','Dec');
var ToTime=new Date();
var ToMonth=months[ToTime.getMonth()];
var ToDate= ToTime.getDate();
var ToYear=ToTime.getYear();
var ToDate = ToMonth + ' ' + ToDate + ', ' + ToYear;
var FromTime = ToTime;
FromTime.setDate(FromTime.getDate()-30);
var FromMonth=months[FromTime.getMonth()];
var FromDate= FromTime.getDate();
var FromYear=FromTime.getYear();
var FromDate = FromMonth + ' ' + FromDate + ', ' + FromYear;
pickerControlFromDate.setValue(FromDate);
pickerControlToDate.setValue(ToDate);
}
DefaultDateSelection();
</script>
Note: This technique uses JavaScript against underlying report objects in a IBM Cognos 8 BI report. For this reason, there is no guarantee that reports created using this technique will migrate or upgrade successfully to future versions without requiring modifications. Any such modifications are the responsibility of the report designer.
6.JavaScript to Deselect Value Prompt Box Selections
Step 1: Name the Value prompt as Owner.
Step 2: Drag a HTML Item into the report just below the Value Prompt and insert the below script into the same:
Step 2: Drag a HTML Item into the report just below the Value Prompt and insert the below script into the same:
<script type="text/javascript">
function Refresh()
{
var fW = (typeof getFormWarpRequest == "function" ?getFormWarpRequest() : document.forms["formWarpRequest"]);
if ( !fW || fW == undefined)
{ fW = ( formWarpRequest_THIS_ ?formWarpRequest_THIS_ : formWarpRequest_NS_ );
}
var obj = fW._oLstChoicesOwner;
obj.selectedIndex = -1;
}
</script>
<input type='button' onclick='Refresh()' value='Refresh'>
Note: This technique uses JavaScript against underlying report objects in a IBM Cognos 8 BI report. For this reason, there is no guarantee that reports created using this technique will migrate or upgrade successfully to future versions without requiring modifications. Any such modifications are the responsibility of the report designer.
7.Expand / Collapse Javascript
Very recently I implemented a requirement to provide expand / collapse feature in long-spanning reports. The JavaScript for this is available on Cognos Support Site. Wish Cognos provides objects for this rather than using javascripts that can prove to be unreliable during upgrades.
What I wanted to focus on through this article is to provide an overview of what this JS does, because it is important to understand the code that you include/integrate into your reports so it is easier to debug issues.
The code is fairly self-explanatory. I have explained the code at a high level:
[User comments: RecoveringAdmin]
What I wanted to focus on through this article is to provide an overview of what this JS does, because it is important to understand the code that you include/integrate into your reports so it is easier to debug issues.
The code is fairly self-explanatory. I have explained the code at a high level:
- Identify the selected row (the row for which an expand/collapse has been initiated).
- Switch the icon for the selected row from an expand to collapse or vice-versa.
- Process all rows below the selected row.
- For each row processed, called as current row, identify if the initiated function was an expand/collapse.
- If collapse, then set style property for current row to "none" which will hide current row. If the current row contains an image and if the image is a collapse icon, then re-set the icon to expand icon and hide the row by setting the style property to "none". All rows below the row clicked get hidden and any collapse icons are re-set so when the higher level is expanded, the clickable rows below display an expand icon and not a collapse icon.
- If expand, and if the current row is at level lower than immediate lower level, then set style property for current row to "none" to hide the row. If the current row is at an immediate lower level then set style to "" to display this row. If the current row contains an image, and if the current row is a sibling level for the selected level then do not process the row.
- The StartHidden function is called on load of the page. This function gets the table element and hides all rows where padding has been set by setting the style property to "none". Thus all rows except the 1st level rows get hidden on load of the report.
[User comments: RecoveringAdmin]
I implemented this as well when I saw that article in the KB. Well, more specifically, when my users saw that article. The downsides I found with this solution are that it's HTML ONLY. if you want to export a specific state to xls or pdf (say, a few rows expanded, some contracted) you would have to screen scrape and repass those selections to cognos as part of some parameter set. Just rerunning the report to another format will disregard the javascript. (pdf and xls engine rebuilds the result set and disregards the html blocks). It's a neat trick, but not super useful as a report output.
Note: This technique uses JavaScript against underlying report objects in a IBM Cognos 8 BI report. For this reason, there is no guarantee that reports created using this technique will migrate or upgrade successfully to future versions without requiring modifications. Any such modifications are the responsibility of the report designer.
<script>
// These settings you can change to modify the report processing
var UOM="px"; // Set to unit of measure for padding
var INDENT_SIZE=20; // Set to indent padding step size. Setting to 20 means the padding steps are 20,40,60,80. These have to match the padding applied to the report objects
var UOM_SIZE = UOM.length;
function stripTrailing(string,num) {
if ( string == "") {return parseInt(0);} else {return parseInt(string.substring(0,string.length-num));}
}
function ExpandCollapse( el )
{
// Grab the ROW that was clicked and the TABLE that contains it
var tr = el.parentElement.parentElement;
var tbl = tr.parentElement.parentElement;
// Set the alternating display values for hiding/showing the row
var sDisplay = ( el.src.indexOf( "minus" ) == -1 ) ? "" : "none";
var sDisplayReverse = ( el.src.indexOf( "minus" ) == -1 ) ? "none" : "";
//Switch the icon for the clicked row
el.src = "../pat/images/PropertyGroup_" + ( el.src.indexOf( "minus" ) == -1 ? "minus" : "plus" ) + ".gif";
// Starting with the row below the clicked row, start checking each row
for ( var i = tr.rowIndex + 1; i < tbl.rows.length; i++ )
{
// Set the Current row indicator nad the left padding value
var trCurrent = tbl.rows( i );
var trCurrentLeft = trCurrent.cells(0).style.paddingLeft;
// if the current row contains an IMG in it, it's a clickable level and we either have to stop processing,
// or reset the icons to a + as it's being collapsed
if ( trCurrent.cells( 0 ).firstChild && trCurrent.cells( 0 ).getElementsByTagName( "IMG" ).length )
{
// If the current row is at the same level or above in the tree, then stop processing,
// else reset all the signs below it, essentially collapsing all branches underneath the one that is beig collapsed.
if ( stripTrailing(trCurrentLeft , UOM_SIZE) <= stripTrailing(tr.cells(0).style.paddingLeft , UOM_SIZE) )
{ break; }
else
{
if (el.src.indexOf( "minus" ) == -1 )
{
trCurrent.cells(0).getElementsByTagName("IMG").item(0).src = "../pat/images/PropertyGroup_plus.gif";
}
}
}
// Now, we determine if the row should be hidden or shown.
if ( eval(stripTrailing(tr.cells(0).style.paddingLeft, UOM_SIZE) + INDENT_SIZE) < stripTrailing(trCurrentLeft, UOM_SIZE) && el.src.indexOf( "minus" ) > 0 )
{
trCurrent.style.display = sDisplayReverse;
} else
{
trCurrent.style.display = sDisplay;
}
}
}
function StartHidden(el)
{
var tbl=el.parentElement.parentElement.parentElement.parentElement;
for (var i = 0; i < tbl.rows.length; i++)
{
var trCurrent = tbl.rows(i);
if (trCurrent.cells(0).style.paddingLeft.indexOf(UOM) > -1)
{
trCurrent.style.display = "none";
}
}
}
</script>
8.My First Fusion Chart
Thanks to the articles provided by PaulM I was able to create a simple FusionChart. But a disadvantage that I discovered with the integration using embedded object method as mentioned on the FusionCharts website is the non-support of rendering charts with pure JavaScript option using this method.
Since we have some users who would like to use iPad/iPhone for viewing Cognos reports in the future this would not be an optimal solution for us. I wanted to highlight some such limitations provided in the FusionCharts website so people can make informed decisions regarding such integrations.
"When embedding using OBJECT/EMBED method, only Flash charts will show up. Additionally, features such as JSON data support, managed printing in Mozilla based browsers and enhanced browser-specific error handling would not function as well, as they are dependent on the FusionCharts JavaScript class."
Also when using pure JavaScript rendering of charts not all features available with the flash charts are supported. Like the scroll bars available for flash based charts that I was really impressed with are not available in the JS version of the charts. Hoping that this would be addressed in future releases.
I am still working on the CMS and JS rendering approach due to the limitation discussed above. Hope support for JS rendering of charts using object embedding method is brought out in future releases.

9.Hide/Display Drill Through Links based on Levels
In a dimensional report, how do you hide/display drill through links based on the levels of a dimension when drills are enabled on the dimension? Layout calculations/Style Variables/Conditional Style conditions do not support MDX functions. So how do we identify the level of the dimension that you are at and apply conditions to the drill through links to hide or display them?
This is where JavaScript comes to our rescue. As always, JS should be used at the developer's discretion as they are not supported by IBM and also these get executed at the client side and hence should not be used in data intensive reports.
Solution:
Step 1: Create the base report and enable drills in the report.
Step 2: Create the drill through links in the crosstab for the Quantity measure.
Step 3: Insert another Quantity data item along side the Quantity measure without drill through links.
Step 4: Insert a singleton, pointing to the Crosstab Query and insert a calculated data item: Ordinal - ordinal(level(item([Product line],0))).
Step 5: Insert 2 HTML Items before and after the singleton.
<div id='Lvl'>
</div>
Step 6: Insert 2 HTML items before and after the Quantity measure in the crosstab that doesn't have the drill through link.
<div id='NoLinks'>
</div>
Step 7: Insert 2 HTML items before and after the Quantity measure in the crosstab that has the drill through link.
<div id='Links'>
</div>
Step 8: Insert a HTML item below the crosstab. Include the below JS:
<script>
var Lvl = document.getElementById('Lvl');
var LvlSpan = Lvl.getElementsByTagName('span')[0];
var LvlVal = LvlSpan.innerHTML;
if(LvlVal==4)
{
for(i=0;i < document.getElementsByTagName('div').length;i++)
{
if(document.getElementsByTagName('div')[i].id=='Links')
{
document.getElementsByTagName('div')[i].style.display = 'block';
}
if(document.getElementsByTagName('div')[i].id=='NoLinks')
{
document.getElementsByTagName('div')[i].style.display = 'none';
}
}
}
else
{
for(i=0;i < document.getElementsByTagName('div').length;i++)
{
if(document.getElementsByTagName('div')[i].id=='Links')
{
document.getElementsByTagName('div')[i].style.display = 'none';
}
if(document.getElementsByTagName('div')[i].id=='NoLinks')
{
document.getElementsByTagName('div')[i].style.display = 'block';
}
}
}
</script>


Note: These techniques use JavaScript against underlying report objects in a IBM Cognos 8 BI report. For this reason, there is no guarantee that reports created using these techniques will migrate or upgrade successfully to future versions without requiring modifications. Any such modifications are the responsibility of the report designer.
| <report xmlns="http://developer.cognos.com/schemas/report/8.0/" useStyleVersion="10" expressionLocale="en-us"> <modelPath>/content/folder[@name='Samples']/folder[@name='Models']/package[@name='GO Sales (analysis)']/model[@name='model']</modelPath> <queries> <query name="Query1"> <source> <model/> </source> <selection><dataItemMeasure name="Quantity"><dmMember><MUN>[Sales (analysis)].[Sales].[Quantity]</MUN><itemCaption>Quantity</itemCaption></dmMember><dmDimension><DUN>[Sales (analysis)].[Sales]</DUN><itemCaption>Sales</itemCaption></dmDimension><XMLAttributes><XMLAttribute name="RS_dataType" value="1" output="no"/></XMLAttributes></dataItemMeasure><dataItemMeasure name="Unit cost"><dmMember><MUN>[Sales (analysis)].[Sales].[Unit cost]</MUN><itemCaption>Unit cost</itemCaption></dmMember><dmDimension><DUN>[Sales (analysis)].[Sales]</DUN><itemCaption>Sales</itemCaption></dmDimension><XMLAttributes><XMLAttribute name="RS_dataType" value="2" output="no"/></XMLAttributes></dataItemMeasure><dataItemMeasure name="Revenue"><dmMember><MUN>[Sales (analysis)].[Sales].[Revenue]</MUN><itemCaption>Revenue</itemCaption></dmMember><dmDimension><DUN>[Sales (analysis)].[Sales]</DUN><itemCaption>Sales</itemCaption></dmDimension><XMLAttributes><XMLAttribute name="RS_dataType" value="2" output="no"/></XMLAttributes></dataItemMeasure><dataItemLevelSet name="Product line"><dmLevel><LUN>[Sales (analysis)].[Products].[Products].[Product line]</LUN><itemCaption>Product line</itemCaption></dmLevel><dmDimension><DUN>[Sales (analysis)].[Products]</DUN><itemCaption>Products</itemCaption></dmDimension><dmHierarchy><HUN>[Sales (analysis)].[Products].[Products]</HUN><itemCaption>Products</itemCaption></dmHierarchy></dataItemLevelSet><dataItem name="Ordinal"><expression>ordinal(level(item([Product line],0)))</expression></dataItem></selection> </query> </queries> <layouts> <layout> <reportPages> <page name="Page1"><style><defaultStyles><defaultStyle refStyle="pg"/></defaultStyles></style> <pageBody><style><defaultStyles><defaultStyle refStyle="pb"/></defaultStyles></style> <contents> <singleton name="Singleton1" refQuery="Query1"> <contents><HTMLItem> <dataSource> <staticValue><div id='Lvl'></staticValue> </dataSource> </HTMLItem><textItem><dataSource><dataItemValue refDataItem="Ordinal"/></dataSource></textItem><HTMLItem> <dataSource> <staticValue></div></staticValue> </dataSource> </HTMLItem></contents> </singleton><crosstab refQuery="Query1" horizontalPagination="true" name="Crosstab1"> <crosstabCorner><style><defaultStyles><defaultStyle refStyle="xm"/></defaultStyles></style><contents/></crosstabCorner> <noDataHandler> <contents> <block> <contents> <textItem> <dataSource> <staticValue>No Data Available</staticValue> </dataSource> <style> <CSS value="padding:10px 18px;"/> </style> </textItem> </contents> </block> </contents> </noDataHandler> <style> <defaultStyles> <defaultStyle refStyle="xt"/> </defaultStyles> <CSS value="border-collapse:collapse"/> </style> <crosstabColumns><crosstabNode><crosstabNodeMembers><crosstabNodeMember refDataItem="Quantity" edgeLocation="e1"><style><defaultStyles><defaultStyle refStyle="ml"/></defaultStyles></style><contents><textItem><dataSource><memberCaption/></dataSource></textItem></contents></crosstabNodeMember></crosstabNodeMembers></crosstabNode><crosstabNode><crosstabNodeMembers><crosstabNodeMember refDataItem="Unit cost" edgeLocation="e2"><style><defaultStyles><defaultStyle refStyle="ml"/></defaultStyles></style><contents><textItem><dataSource><memberCaption/></dataSource></textItem></contents></crosstabNodeMember></crosstabNodeMembers></crosstabNode><crosstabNode><crosstabNodeMembers><crosstabNodeMember refDataItem="Revenue" edgeLocation="e3"><style><defaultStyles><defaultStyle refStyle="ml"/></defaultStyles></style><contents><textItem><dataSource><memberCaption/></dataSource></textItem></contents></crosstabNodeMember></crosstabNodeMembers></crosstabNode></crosstabColumns><crosstabFactCell><contents><textItem><dataSource><cellValue/></dataSource></textItem></contents><style><defaultStyles><defaultStyle refStyle="mv"/></defaultStyles></style></crosstabFactCell><crosstabRows><crosstabNode><crosstabNodeMembers><crosstabNodeMember refDataItem="Product line" edgeLocation="e4"><style><defaultStyles><defaultStyle refStyle="ml"/></defaultStyles></style><contents><textItem><dataSource><memberCaption/></dataSource></textItem></contents></crosstabNodeMember></crosstabNodeMembers></crosstabNode></crosstabRows><crosstabIntersections><crosstabIntersection row="e4" column="e1"><contents><HTMLItem> <dataSource> <staticValue><div id='NoLinks'></staticValue> </dataSource> </HTMLItem><textItem><dataSource><dataItemValue refDataItem="Quantity"/></dataSource></textItem><HTMLItem> <dataSource> <staticValue></div></staticValue> </dataSource> </HTMLItem><HTMLItem> <dataSource> <staticValue><div id='Links'></staticValue> </dataSource> </HTMLItem><textItem><dataSource><dataItemValue refDataItem="Quantity"/></dataSource><reportDrills><reportDrill name="Drill-Through Definition1"><drillLabel><dataSource><staticValue/></dataSource></drillLabel><drillTarget><reportPath path="CAMID("Zynga_AD:u:2a4aa6305669dc40b168f26119e56912")/folder[@name='My Folders']/folder[@name='PoC']/report[@name='Tgt']"><XMLAttributes><XMLAttribute name="ReportName" value="Tgt" output="no"/><XMLAttribute name="class" value="report" output="no"/></XMLAttributes></reportPath></drillTarget></reportDrill></reportDrills><style><defaultStyles><defaultStyle refStyle="hy"/></defaultStyles></style></textItem><HTMLItem> <dataSource> <staticValue></div></staticValue> </dataSource> </HTMLItem></contents></crosstabIntersection></crosstabIntersections></crosstab> <HTMLItem> <dataSource> <staticValue><script> var Lvl = document.getElementById('Lvl'); var LvlSpan = Lvl.getElementsByTagName('span')[0]; var LvlVal = LvlSpan.innerHTML; if(LvlVal==4) { for(i=0;i < document.getElementsByTagName('div').length;i++) { if(document.getElementsByTagName('div')[i].id=='NoLinks') { document.getElementsByTagName('div')[i].style.display = 'block'; } } } else { for(i=0;i < document.getElementsByTagName('div').length;i++) { if(document.getElementsByTagName('div')[i].id=='NoLinks') { document.getElementsByTagName('div')[i].style.display = 'none'; } } } </script></staticValue> </dataSource> </HTMLItem></contents> </pageBody> <pageHeader> <contents> <block><style><defaultStyles><defaultStyle refStyle="ta"/></defaultStyles></style> <contents> <textItem><style><defaultStyles><defaultStyle refStyle="tt"/></defaultStyles></style> <dataSource> <staticValue/> </dataSource> </textItem> </contents> </block> </contents> <style> <defaultStyles> <defaultStyle refStyle="ph"/> </defaultStyles> <CSS value="padding-bottom:10px"/> </style> </pageHeader> <pageFooter> <contents> <table> <tableRows> <tableRow> <tableCells> <tableCell> <contents> <date> <style> <dataFormat> <dateFormat/> </dataFormat> </style> </date> </contents> <style> <CSS value="vertical-align:top;text-align:left;width:25%"/> </style> </tableCell> <tableCell> <contents> <pageNumber/> </contents> <style> <CSS value="vertical-align:top;text-align:center;width:50%"/> </style> </tableCell> <tableCell> <contents> <time> <style> <dataFormat> <timeFormat/> </dataFormat> </style> </time> </contents> <style> <CSS value="vertical-align:top;text-align:right;width:25%"/> </style> </tableCell> </tableCells> </tableRow> </tableRows> <style> <defaultStyles> <defaultStyle refStyle="tb"/> </defaultStyles> <CSS value="border-collapse:collapse;width:100%"/> </style> </table> </contents> <style> <defaultStyles> <defaultStyle refStyle="pf"/> </defaultStyles> <CSS value="padding-top:10px"/> </style> </pageFooter> </page> </reportPages> </layout> </layouts> <XMLAttributes><XMLAttribute name="RS_CreateExtendedDataItems" value="true" output="no"/><XMLAttribute name="listSeparator" value="," output="no"/><XMLAttribute name="RS_modelModificationTime" value="2011-06-09T13:51:23.483Z" output="no"/></XMLAttributes><reportName>Src</reportName><drillBehavior drillUpDown="true" modelBasedDrillThru="true"/></report> |
10.Tree Prompt on Relational Models using Prompt API
There is already an article published on using single select tree prompt against relational models that makes use of prompt macros. This article focuses on using the Prompt API against the Tree prompt making it easier to use the Tree prompt against a relational model.
This method works for multi-select tree prompts as well. The solution can be extended to get prompt selected data for the various levels and using them individually in the reports for various other solutions.
Using this method we can do away with writing complex macros to massage the prompt data to suit the relational model.
The solution is simple:
Assuming the MUNs have Year, Q, Month included in them to help identify the levels, if not you will have to modify the sections referring to val.indexOf("Year"), val.indexOf("Q"), val.indexOf("Month") to match your MUN sections to identify Year, Quarter and Month:
- Have a couple of hidden text box prompts in the report depending on the number of levels you have in the tree prompt.
- Use the prompt API to get the list of selected prompt values.
- Identify the level of the selected prompt value.
- Transform the prompt value to a relational value.
- Append the prompt value in the respective text box prompt.
- Create filters in the query passing in the text box prompt values.
Step 1: Create the tree prompt and a list report to get the required data.
Step 2: Name the tree prompt as "treePrompt".
Step 3: Create 3 hidden text box prompts named YearPrompt, QrtrPrompt, MonthPrompt.
Step 4: Create filters in the list query to accept the parameter values from YearPrompt, QuarterPrompt, MonthPrompt as mentioned below:
(#csv(split(';',promptMany('pYear','token')))#)
Step 5: Insert an HTML item with the below prompt API code:
 <script>
 function Prompts() {
   var oCR = cognos.Report.getReport("_THIS_");
   var treePrompt = oCR.prompt.getControlByName("treePrompt");
   var YearPrompt = oCR.prompt.getControlByName("YearPrompt");
   var QrtrPrompt = oCR.prompt.getControlByName("QrtrPrompt");
   var MonthPrompt = oCR.prompt.getControlByName("MonthPrompt");
   var vYear = ';';
   var vQrtr = ';';
   var vMonth = ';';
   vPreString = "[";
   vPostString = "]";
   var vTree = treePrompt.getValues();
   var valStart, valEnd;
   for (i = 0; i < vTree.length; i++) {
     var val = vTree[i].use;
     if (val.indexOf("Year") > 0) {
       valStart = val.lastIndexOf(vPreString);
       valEnd = val.lastIndexOf(vPostString);
       vYear = vYear.concat(val.substring(valStart + 1, valEnd));
       vYear = vYear.concat(";");
     }
     if (val.indexOf("Q") > 0) {
       valStart = val.lastIndexOf(vPreString);
       valEnd = val.lastIndexOf(vPostString);
       vQrtr = vQrtr.concat(val.substring(valStart + 1, valEnd));
       vQrtr = vQrtr.concat(";");
     }
     if (val.indexOf("Month") > 0) {
       valStart = val.lastIndexOf(vPreString);
       valEnd = val.lastIndexOf(vPostString);
       vMonth = vMonth.concat(val.substring(valStart + 1, valEnd));
       vMonth = vMonth.concat(";");
     }
   }
   var vYearArr = new Array();
   var clmns = {
     use: vYear
   };
   vYearArr[0] = clmns;
   YearPrompt.setValues(vYearArr);
   var vQrtrArr = new Array();
   var clmnsQrtr = {
     use: vQrtr
   };
   vQrtrArr[0] = clmnsQrtr;
   QrtrPrompt.setValues(vQrtrArr);
   var vMonthArr = new Array();
   var clmnsMonth = {
     use: vMonth
   };
   vMonthArr[0] = clmnsMonth;
   MonthPrompt.setValues(vMonthArr);
   oCR.sendRequest(cognos.Report.Action.FINISH);
 }
 </script>


12.Autosubmit Cognos prompt page using java script
Take HTML to prompt page and paste the following code
<script type="text/javascript">
//get the form request
var fW = (typeof getFormWarpRequest == "function" ? getFormWarpRequest() : document.forms["formWarpRequest"]);
if (fW)
{
// if the report is running from reportStudio or the Portal objects are different
if (fW.elements["cv.id"].value == "RS")
{
setTimeout('oCVRS.promptAction(\'next\')', 1000);
}else{
setTimeout('oCV_NS_.promptAction(\'next\')', 1000);
}
}
</script
13.Hide tool bar in cognos viewer
1) Take HTML drop in Header
paste the following code
<script language="JavaScript">
var y=getFormWarpRequest().elements["cv.id"];
// RS means it has been launched from Report Studio
// _NS_ means it has been launched from Cognos Connection
if(y.value == "RS") {
window.oCVRS.rvMainWnd.setToolbar(
{
"namespace":"RS",
"divId":"CVToolbarRS",
"style":"toolbar","S":[
{"P":
{"Y":"vertical_line"}
},
{"P":
{"Y":"vertical_line"}
},
{"P":
{"Y":"vertical_line"}
},
{"P":
{"Y":"vertical_line"}
},
{"P":
{"Y":"vertical_line"}
},
{"B":
{"N":"openWith",
"M":
{"id":"openWithwindow.oCVRS",
"Y":"dropDown",
"H":"true",
"IS":[]}
}
}
]
}
);
}else{
window.oCV_NS_.rvMainWnd.setToolbar(
{"namespace":"_NS_",
"divId":"CVToolbar_NS_",
"style":"toolbar",
"S":[
{"P":
{"Y":"vertical_line"}
},
{"P":
{"Y":"vertical_line"}
},
{"P":
{"Y":"vertical_line"}
},
{"P":
{"Y":"vertical_line"}
},
{"P":
{"Y":"vertical_line"}
},
{"B":
{"N":"openWith",
"M":
{"id":"openWithwindow.oCV_NS_",
"Y":"dropDown",
"H":"true",
"IS":[]}
}
}
]
}
);
}
</script>
14.Hide excel/xml/csv output options in cognos viewer using java script
create HTML item in header/footer of the report and copy and paste the following code
<script language="JavaScript">
var y=getFormWarpRequest().elements["cv.id"];
// RS means it has been launched from Report Studio
// _NS_ means it has been launched from Cognos Connection
if(y.value == "RS") {
window.oCVRS.rvMainWnd.setToolbar(
{
"namespace":"RS",
"divId":"CVToolbarRS",
"style":"toolbar","S":[
{"P":
{"Y":"vertical_line"}
},
{"P":
{"Y":"vertical_line"}
},
{"P":
{"Y":"vertical_line"}
},
{"P":
{"Y":"vertical_line"}
},
{"B":
{"N":"runIn",
"ALT":"Change report format",
"M":
{"id":"runInwindow.oCVRS",
"Y":"dropDown",
"IS":[
{"I":
{"N":"viewInHTML",
"A":"window.oCVRS.getRV().viewReport(\'HTML\');",
"E":"View in HTML Format",
"C":"/ibmcognos/rv/images/action_view_html.gif"}
},
{"I":
{"N":"viewInPDF",
"A":"window.oCVRS.getRV().viewReport(\'PDF\');",
"E":"View in PDF Format",
"C":"/ibmcognos/rv/images/action_view_pdf.gif"}
}
]
}
}
},
{"P":
{"Y":"vertical_line"}
},
{"B":
{"N":"openWith",
"M":
{"id":"openWithwindow.oCVRS",
"Y":"dropDown",
"H":"true",
"IS":[]}
}
}
]
}
);
}else{
window.oCV_NS_.rvMainWnd.setToolbar(
{"namespace":"_NS_",
"divId":"CVToolbar_NS_",
"style":"toolbar",
"S":[
{"P":
{"Y":"vertical_line"}
},
{"P":
{"Y":"vertical_line"}
},
{"P":
{"Y":"vertical_line"}
},
{"P":
{"Y":"vertical_line"}
},
{"B":
{"N":"runIn",
"ALT":"Change report format",
"M":
{"id":"runInwindow.oCV_NS_",
"Y":"dropDown",
"IS":[
{"I":
{"N":"viewInHTML",
"A":"window.oCV_NS_.getRV().viewReport(\'HTML\');",
"E":"View in HTML Format",
"C":"/ibmcognos/rv/images/action_view_html.gif"}
},
{"I":
{"N":"viewInPDF",
"A":"window.oCV_NS_.getRV().viewReport(\'PDF\');",
"E":"View in PDF Format",
"C":"/ibmcognos/rv/images/action_view_pdf.gif"}
}
]
}
}
},
{"P":
{"Y":"vertical_line"}
},
{"B":
{"N":"openWith",
"M":
{"id":"openWithwindow.oCV_NS_",
"Y":"dropDown",
"H":"true",
"IS":[]}
}
}
]
}
);
}
</script>
No comments:
Post a Comment