REPORT STUDIO TECHNICS
List of Topics in this Artical:- Performance improvement Ideas for a Report.
- Bookmarks in Cognos
- PAGE BREAK IN REPORT
- JUSTIFY EMPTY VALUES
- HIDE EMPTY TABLE
- MOUSEOVER TEXT ON COGNOS LIST HEADER
- DYNAMIC CURRENT MONTH SELECTION
- DISPLAYING DIFFERENT COLORS FOR ALTERNATE ROWS
- INFORMATION POP-UP IN COGNOS REPORT
- WORKING WITH DATES IN COGNOS
- SHOW PROMPT VALUE IN REPORT
- SECTION IN REPORT
- MULTI DIMENSIONAL FUNCTIONS
- MAXIMIZE REPORT WINDOW
- MINI CHART IN CROSSTAB ROW
- ADAPT SCREENSIZE FOR COGNOS REPORT
- TEXT BOX PROMPT WITH MULTIPLE VALUES TO FILTER
- GROUP ROWS IN COGNOS REPORT LIST
- BUTTON TYPES FOR COGNOS
- CHANGE DEFAULT OPTION IN SEARCH AND SELECT PROMPT
- CROSSTAB COLUMN TRUNCATED IN DASHBOARD
- ANIMATED DROPDOWN PROMPT
- REPORT STUDIO OPENS WITH BLANK SCREEN
- TOTAL FOR PERCENTAGE COLUMN CROSSTAB
- CONDITIONAL STYLES
- CUSTOM CHART PALETTES
- DIVIDE BY ZERO
- DataSource Connection
- Create Data Source and Data Source Connections
- Disable drill down at particular level
- Conditional Layouts
- Time Dimension Design from Cognos Perspective
- Calculated Measures
- Cross Product Confusion
- Stitched query, star schema grouping and cognos FM
- Joins at which layer ??
- Dynamic datasource selection - Report Studio Report
- Cognos: to_char functionality without using to_char
- Auto Correct option in Report Studio(Validate Promopt)
- Case Statement Issues in 8.4 with Dimensional Model
- Use Singleton to display data when there is no data in Report Page Query
- List vs Chart
- Avoiding Meta data Callbacks due to Hard-Coded SQLs
- Macro Prompts in FM Model for Adhoc Packages
- Multiple Queries for different data containers
- User Query - Display Totals for Top 2 Ranks while displaying data for all other ranks in a crosstab?
- Deleting Report Output Versions
- Using Text Wrap property instead of setting Widths
- Defect - Duplicate Queries generated by Cognos
- Adding Comments to Saved Report Output Versions
- Cognos 10 - Scheduling Features
- Remap to New Source in FM ( Update latest changes)
- Avoid Paginating Saved HTML Outputs
- Chart Conditional Measures - Conditional Legend
- Report Studio : Scrollable Lists
- User Query - Creating Overall Percentage Summary Values in Reports
- Cognos 10 Prompts - New Features
- COGNOS: Add a Multimedia File to a Report
- COGNOS: Saving Reports to a Local Directory
- Filter a report based on comma separated values entered in a text box prompt
- Cognos Schedule report will be not delivered issue?
- Cognos Chart limitations in EXCEL
- COGNOS: Difference between Two values in a COLUMN
- COGNOS: CSV or Excel output limitatoins
- Report Studio: Prompt Expressions between Relational and Dimensional Packages
- Report Studio: Fixing the Size of Select & Search Prompt Dynamic
Performance improvement Ideas for a Report.
1) Only those data items which are required.
2) use a single query for crosstabs and make crosstabs have similar dataitems placed, it will help cognos generate a single query.
3) Use case when condition in filter rather then in dataitem and then use that dataitem in the filter.
4) use FM for fitering data
5) do not use BETWEEN
6) If you are doing inner join b/w 2 quries then better write your own quries.
7) make sure Minimized sql is created by the FM and proper joins are there.
8) Sometime you create a single query and use it in second query. In second qeury you put a filter on the first query. This is will definately slow the whole process. Instead of putting a filter on second query , do something a put a fitler in first query itself so that limite data is provided to second query.
9)have the indexes placed on the dataitmes you have filter on.
10)Formatting funtions also takes time.
11) Dont do time based calculations on run time.
Follow this Steps:
Follow this Steps:
1. Don’t use the Not in function in the query.
2. Check the Governor Settings.
3. Check the table qualifying and weighting.
4. Check the client/server balancing.
5. Avoid using complex calculations avoid complex reportcheck filter condition,use less filteravoid unwanted calculation.
1. Don’t use the Not in function in the query.
2. Check the Governor Settings.
3. Check the table qualifying and weighting.
4. Check the client/server balancing.
5. Avoid using complex calculations avoid complex reportcheck filter condition,use less filteravoid unwanted calculation.
------------------------------------------------------------------------------
2. Check the Governor Settings.
3. Check the table qualifying and weighting.
4. Check the client/server balancing.
5. Avoid using complex calculations avoid complex reportcheck filter condition,use less filteravoid unwanted calculation.
-------------------------------------------------------------------
Follow this Steps1. Don’t use the Not in function in the query.
2. Check the Governor Settings.
3. Check the table qualifying and weighting.
4. Check the client/server balancing.
5. Avoid using complex calculations avoid complex reportcheck filter condition,use less filteravoid unwanted calculation.
------------------------------------------------------------------------------
IBM has uploaded several videos which walk you through some of the Tips and techniques to achieve Maximum performance
IBM Cognos BI - Designing Reports for Performance - Part 5
http://www.youtube.com/watch?v=c170hFlmdWA
IBM Cognos BI - Designing Reports for Performance - Part 1
http://www.youtube.com/watch?v=OiRvUrUTs-c
IBM Cognos BI - Designing Reports for Performance - Part 3
http://www.youtube.com/watch?v=zLS26-zKsCI
IBM Cognos BI - Designing Reports for Performance - Part 2
http://www.youtube.com/watch?v=QiIIPlaCMOU
IBM Cognos BI - Designing Reports for Performance - Part 4
http://www.youtube.com/watch?v=XbSbXoxxzeA
Bookmarks in Cognos

You can see here four columns have been added to the list , one column variable descr have been converted into a section. Unlock report and click Variable descr column and go to its properties
>Drill Through Definitions > Bookmark Tab
change SourceType value to 'DataItem Value' , Click OK.
Add a book mark just adjscant to variable descr and go to bookmarks properties.
Change source Type property to 'DataItem Value' and DataItemValue property to Varialbe Descr.
Now when you run this report this bookmark will have value of Variable descr value.
Suppose one of the value of Variable descr is 'India' , so now put a text item at the top of the report and go to its drill throug definition and go to bookmark tab and set sourcetype='text' and text=India, now you can run the report and get the output in pdf. In pdf when you click on that text item , it will directly take you to the palce where variable descr is having its value equal to India.
PAGE BREAK IN REPORT
Case:
You want to build a report which shows salesdata per region and show every region on an new page.
Solution:
Create a table with branch, year and some fact data.
Click once on the column branch.
In the toolbar click on Structure > Page-break (with Master/Detail)
After that you can also click on ‘Section’. This way you create an header per page for Region.
See Section in report for more enhancement details.
Cognos: Page break on reporting objects
suppose we have list, cross tab, chart reports on single page and when we run the report, we want to have list on one page, cross tab on another page and chart on third page..
Just watch the following vedio...
http://www.youtube.com/watch?feature=player_embedded&v=bT7jhGwanNo
Just watch the following vedio...
http://www.youtube.com/watch?feature=player_embedded&v=bT7jhGwanNo
JUSTIFY EMPTY VALUES
Case:
When you work with a report, based on an dimensional model, it can occur that the result shows a lot of empty values.

This is not what you would like to see. Instead you would like to see only the rows that have a value.
Solution:
To achieve this you can use the following solution:
– In the report choose filter
– Click on the icon to add a new filter
– In the report choose filter
– Click on the icon to add a new filter

– Put a filter on the Amount [Aantal] column of the FACT

– In the Expression Definition you put: [Aantal] IS NOT NULL
HIDE EMPTY TABLE
Case:
Often when you run a report it shows no data, because of filters for example. In that case you only see the header of the table, the data is empty. Instead you want to show the user there is no data.
Solution:
Use the following steps:
1. Select the table witch you don’t want to show in case of no data
2. In the properties pane go to “No data contents” (Geen gegevens beschikbaar)

3. Change the property from “No” to “Yes”. The table changes.

4. Select a text item into the new area. Edit the text as you like, eg. “No data for this selection”

Result:
Result when running the report
MOUSEOVER TEXT ON COGNOS LIST HEADER
When you want to show some explanatory text on a mouseover on a list header you can use the following solution:
1. Unlock the report
2. Drag a HTML item before the header text item
3. Add the HTML: <span title=”Text to show on hoover”>
4. Drag a HTML item after the header text item
5. Add the HTML: </span>
6. Lock the report
Run the report to see the result.
DYNAMIC CURRENT MONTH SELECTION
I found some interesting knowlegde on getting the current month dynamicly as a filter in Cognos. Here are the steps how:
Expand your time dimension and select any month member (Members are the one with the blue rectangle icon).
Right click on the member and select Properties, and you will see there a property called Member Unique Name. This is usually structured like this: [cube].[dimension].[hierarchy].[level]->:[PC].[@MEMBER].[Name]
Once you have that, copy it. Look at the structure – we’re interested in the last bit – how is a month MUN constructed.
For our example, we’ll suppose it is built like this:[Sales].[Time].[Time].[Month]->[Time].[2010].[201003] (That’s March 2010, yyyymm).
So, you create a data item like this:
#’[Sales].[Time].[Time].[Month]->[Time].['+ timestampMask($current_timestamp,'yyyy')+'].['+timestampMask($current_timestamp,'yyyy')+timestampMask($current_timestamp,'mm')+']‘#
Which will dynamically translate (Today) to [Sales].[Time].[Time].[Month]->[Time].[2014].[201402]
DISPLAYING DIFFERENT COLORS FOR ALTERNATE ROWS
Follow the next steps:
1. Add a query calculation containing a running-count summary eg running-count([Order_no])
2. Add a second query calculation as follows: mod([First calc],2)
3. Set up a boolean variable in the condition explorer with the expression [Second calc] > 0
4. Select ‘list columns body style’ using the Select Ancestor button, select the Style Variable property, and pick your boolean variable.
5. Hover your mouse over the Condition Explorer, select the ‘Yes’ variable value, then set the Background Colour property. Using the condition explorer, switch to the ‘No’ variable value and repeat using a different colour.
6. If your calculations exist in the query but are not shown in the list, select the list using the Select Ancestor button, go to the Properties property, and enable the calculations as properties of the list.
Source: http://www.cognoise.com/index.php/topic,2973.0.html
INFORMATION POP-UP IN COGNOS REPORT
A customer wants some information in the report about filters and conditions.
One way to create this is with some html:
<html>
<head>
<script type=”text/javascript”>
<!–
function Info() {
alert(“<PUT YOUR OWN TEXT /INFORMATION HERE>”);
}
//–>
</script>
</head>
<body>
<!–<p>Can be used to add text before the button:</p>–>
<form>
<input type=”button” value=”REPORT INFORMATION” onclick=”Info();” />
</form>
</body>
</html>
<head>
<script type=”text/javascript”>
<!–
function Info() {
alert(“<PUT YOUR OWN TEXT /INFORMATION HERE>”);
}
//–>
</script>
</head>
<body>
<!–<p>Can be used to add text before the button:</p>–>
<form>
<input type=”button” value=”REPORT INFORMATION” onclick=”Info();” />
</form>
</body>
</html>
WORKING WITH DATES IN COGNOS
In Cognos reports I use various dates. I use today, first day of this year, first day of last year and last day of last year.First and last day of last year is used in january. In february we switch to the current year.
I use the following expressions to fill these dates:
Today: current_date
First day of this year: _add_days(Current_date ; (_day_of_year(Current_date)*-1)+1 )
First day of last year (only used in january): _first_of_month(_add_years(current_date;-1))
Last day of last year (only used in january): _last_of_month(_add_months (current_date;-1))
SHOW PROMPT VALUE IN REPORT
Case:
For a customer I created a report with prompts. The customer uses this report to create output in Excel.
The report shows the prompt value but the output in Excel doesn’t show the choosen prompt values.
Solution:
Add a text item in the report
Give it the name of the prompt eg. PERIOD
Add another text item on the right side of the firts text item
Go to the properties of the text item
Choose instead of TEXT for REPORT EXPRESSION
Highlight the report expression item once.
In the properties pane choose Report Expression. A screen pops up.
In this screen choose the parameter tab. Then add the parameter you want to show and drag it to the expression field.
ParamDisplayValue(<parameter_name>)
To show multiple parameters in one row you can add test to the ParamDisplayValue item.
For example:
‘For the period ‘+ParamDisplayValue(“from”)+’ to ‘+ParamDisplayValue(“to”)
SECTION IN REPORT
Case:
In a report you can work with ‘sections’ to make a grouping more visible. For example you want to show some charts with sales data for each branch of the company.
Solution:
Create a table with ordernumber, product and some fact data.

Run the report to see the result:

Click once on the column ordernumber.
In the toolbar click on the ‘section’ button.

Branch now becomes a header and beneath it shows the relevant data for this branch.

Run the report to see the result:

Enhancements:
When you run the report you wil only see the ordernumber in the header of the section.
You can put the text “Ordernumber:” in front of it.
Do this by click once on the section title
Click on the lock to unlock the report.
Now drag a new text item from the toolbox to the left of the section-item.
Type the text “Branch: ” in the text box.
Lock the report again and run the report to see the result.
MULTI DIMENSIONAL FUNCTIONS
In Cognos you can use a lot of Dimensional functions. Information about these functions can be found on:
You can download a zip-file here witch contains a PDF and a zip-file with examples.
The dimensional functions can be used with crosstab reports with for example year, quarter and sales facts.
A usefull example can be found on Youtube:
MAXIMIZE REPORT WINDOW
Case:
When you are working in report studio and you want to test a report, the windows that opens has a small size. You have to click on the top of the screen (maximize) to get a full size window.
Solution:
In the header of the report you can put a HTML-item with the following script:
<script language=”JavaScript”>
window.moveTo(0,0);
window.resizeTo(screen.width,screen.height);
</script>
When you run the report it automaticly gets a full window size.
Update:
Today I used above script in a report. I found out that the window does maximize but I couldn’t see the page up/down option in the bottom of the screen.
After testing with the following code it works better.
<script language=”JavaScript”>
window.onload = maxWindow;
window.onload = maxWindow;
function maxWindow()
{
window.moveTo(0,0);
{
window.moveTo(0,0);
if (document.all)
{
top.window.resizeTo(screen.availWidth,screen.availHeight);
}
{
top.window.resizeTo(screen.availWidth,screen.availHeight);
}
else if (document.layers||document.getElementById)
{
if (top.window.outerHeight<screen.availHeight||top.window.outerWidth<screen.availWidth)
{
top.window.outerHeight = screen.availHeight;
top.window.outerWidth = screen.availWidth;
}
}
}
{
if (top.window.outerHeight<screen.availHeight||top.window.outerWidth<screen.availWidth)
{
top.window.outerHeight = screen.availHeight;
top.window.outerWidth = screen.availWidth;
}
}
}
</script>
Permanent solution:
It is also possible to put this HTML-item in the report template. This way you always have the HTML-item present in the report.
For examples how to make a report studio template see:
or search google for other examples.
MINI CHART IN CROSSTAB ROW
Case:
You want to display a mini chart in the row of a crosstab.
Solution:
Create a crosstab report with for example: Product-line, year and sales.
Go to the Query Explorer and rename Query1 to Crosstab.
Go to the Query Explorer and copy the Crosstab query. Then click paste and rename the query to Chart.
Create a line chart with the query Chart as source. Add year-month from the date dimension into the query.
From the query drag year-month into the X-axis Catagory. Then drag Sales into Y-axis Default measure.
Define a sort on the X-axis. Select the abc on the X-axis, go to the properties and choose NO for Visible. Select the Y-axis and go to the properties and choose NO for Visible. In the properties of the Chart set Hide for Legend.
Set the size of the graph to 70px (height) and 140px (width) in the Size&Overflow properties of the Chart.
Unlock all objects in the report.
Drag a table into the row with the productlines in the crosstab (1 row, 2 columns).
Drag and drop Product-line into the table. Choose align left for that field of the table.
Now drag the chart into the left field of the table.
Go to the properties of the chart and click on Master Detail Relationships. A propertie box opens. In here create a new link between Product-line from the Query Crosstab and Product-line from the query Chart.
Now run the report to see the result.
ADAPT SCREENSIZE FOR COGNOS REPORT
Case:
You have users in the organisation with different display resolution (800 x 600 and 1024 x 768) for the same Dashboard or report.
How can everyone have maximum screen size?
Solution:
Select the main page of the report.
Look at the properties
Adjust the Size & Overflow properties. Set hight and width to 100% (don’t use px).
You can also try the solution on Maximize report window
TEXT BOX PROMPT WITH MULTIPLE VALUES TO FILTER
In some other forum I came across a solution to add multiple values in a text box prompt.
Say you want to filter a report on:
DEPARTMENT in (‘A’,’B’,’C’)
Drag in a text box prompt with a parameter: p_department
In the query add a filter with the next syntax:
[DEPARTMENT] in (#csv(split(‘,’,prompt(‘p_department’,’token’)))#)
Thanks to CognosPaul on www.cognoise.com
GROUP ROWS IN COGNOS REPORT LIST
Case:
When you create a standard table in a report you can have double rows with the same data

In Cognos it is possible to group these rows
Solution:
Follow the next steps to group the rows in the table
1. Select the column in the table witch you want to group

2. Choose in Report Studio –> Structure –> Group/degroup

3. The result in the table after that:

4. Next run the report and the result looks like:

BUTTON TYPES FOR COGNOS
On a site I found various types for creating buttons on your cognos report:
PDF Button:
<input type=’Button’ value=”Report in PDF” onclick=”javascript:gCognosViewer.getRV().viewReport(‘PDF’)”>
CSV Button:
<input type=’Button’ value=”Report in CSV” onclick=”javascript:gCognosViewer.getRV().viewReport(‘CSV’)”>
XML Button:
<input type=’Button’ value=”Report in XML” onclick=”javascript:gCognosViewer.getRV().viewReport(‘XML’)”>
Excel single Sheet:
<input type=’Button’ value=”Report in Single Excel Sheet” onclick=”javascript:gCognosViewer.getRV().viewReport(‘singleXLS’)”>
Active Report button:
<input type=’Button’ value=”Report in Active Report” onclick=”javascript:gCognosViewer.getRV().viewReport(‘MHT’)”>
Excel 2007 Button:
<input type=’Button’ value=”Report in Excel2007″ onclick=”javascript:gCognosViewer.getRV().viewReport(‘spreadsheetML’)”>
CHANGE DEFAULT OPTION IN SEARCH AND SELECT PROMPT
The default selection of the options in a search and select prompt is set to “Starts with any of these keywords”. I want the default to be “Contains any of these keywords”. To archieve this I found a solution on CogKnowHow.See thisURL for the solution.
The script they provided is:
<script src=”http://code.jquery.com/jquery-1.4.2.js“></script>
<script type=”text/javascript”>
// Possible options:
// swsStartAny = Starts with any of these keywords
// swsStartAll = Starts with the first keyword and contains all of the remaining keywords
// swsMatchAny = Contains any of these keywords
// swsMatchAll = Contains all of these keywords
var $j = jQuery.noConflict();
$j(document).ready(function(){
$j(“input[id*='swsMatchAny']“).attr(“checked”,”true”);
});
</script>
You have to put this script in a HTML-item in the header of the report.
CROSSTAB COLUMN TRUNCATED IN DASHBOARD
Case:
I created a report in report studio with a crosstab in it. When I run the report in report studio it looks fine.
When I run the report in a dashboard the last column of the crosstab is truncated (it is half visible)
Solution:
Adjust the margin of the report page. Follow the next steps:
1. Open the report in Report Studio
2. Hover in the middle over the Page Explorer
3. Select “Report Pages”
4. Click “Page1″ once
5. View the properties for “Margin”
In my case the margin was set to: “20px ? ? 20px”
6. Delete the values for the margin
7. Save the report and run it again in the dashboard
ANIMATED DROPDOWN PROMPT
I came across an article on animated drop down prompts. This article is written by Paul Mendelson, Cognos Guru on the G2 Live Blog
The page of the article is: http://performanceg2.com/2013/07/01/animated-drop-down-prompts-in-cognos/
REPORT STUDIO OPENS WITH BLANK SCREEN
On Windows 7 with Internet Explorer 10 i got a blank screen on opening a report or report studio.
Apply the following to solve this:
1. In IE select TOOLS > OPTIONS > SECURITY

2. Select CUSTOM LEVEL and look for ‘Enable XSS filter’

3.Set the value to ‘DISABLE’ and choose YES on the warning

4.Click OK and restart IE
If above doesn’t work try to switch the ‘COMPATIBILITY VIEW’
TOTAL FOR PERCENTAGE COLUMN CROSSTAB
Case:
In a report studio crosstab often we have some measures and a percentage for that measure.
When you add totals to the crosstab, the column of the percentage is also being totalized. But this is not the right way. For the percentage we want the average instead.
Solution:
Go to the query on the crosstab.
Look for the item that represents the total.
This item has the expression: total(currentMeasure within set [Region])
Change this expression to: aggregate(currentMeasure within set [Region])
Run the report again to see the difference
CONDITIONAL STYLES
Case:
You want to give columns in a table a specific color depending on the value.
For example the number of “products sold”:
0 becomes red
Between 0 and 100 becomes orange
Above 100 becomes green
Solution:
Create a report with region and products sold (number)
Click once on the column “products sold”
On the left panel > Properties > Conditional > Click on Conditional styles
A screen pops up


Choose New Conditional Style
Select the column “products sold” on witch you want to have the style
Type of conditional style: Numeric Range
Click OK
Now you can give the conditional style a recognizable name, e.g. Style Products Sold
Click on the yellow wheel to add a new value > 0
Click on the yellow wheel to add a new value > 100
Define the colors for the range
Move your mouse over middle section of a range to see the values of that range
When you are ready with ranges, values and colors click OK and OK
Run the report to see the result
CUSTOM CHART PALETTES
Some Companies want to have a special set of colors when they use charts in a report.
Underneath an example of two charts. One with default colors an the other with custom colors.


Solution:
This can be achived by editing 2 system XML files.
It is to be recommended to save the original files so you wil be able to return to the original configuration.
The article describes the process by which you can add new chart palettes or customize existing chart palettes for use in IBM Cognos 8 Report Studio.
Click on the following link to open the PDF:
DIVIDE BY ZERO
In a cognos report you can get ‘/0′ as a result in a table.
This is because in that field the calculation is /0.
This is because in that field the calculation is /0.

To avoid this result go to:
– Click on the crosstab intersection
– Choose Data –> Dataformat –> a new box pops up
– Choose Data –> Dataformat –> a new box pops up

– Format type: percent
– Device by Zero Characters: choose ‘-‘
– Device by Zero Characters: choose ‘-‘
DataSource Connection
DataSouce can be defined at 2 places.
a) Cognos Connection
b) Framework Manager
It actually has 2 parts as well. Datasource which is kind of physical connection to the database and second is the datasouce connection which contains the credentials to conenct to the database.
If you see any datasource at the cognos connection,you can actually click on it and you will find the datasource connection(s) under it.You may have multiple datasouce connection for a datasource. When user will run report, he will be prompted to select which datasource connection he wants to use for report.Signon is kind of reusable thing,while defining datasouce connection,you can say that make it signon as well, if you do that then any other person can also use that signon and create many more datasources.He would just need to copy and paste singon from one place to other place(under the new datasource). This work perfactly when you have single ID/PSWD for multiple databases, you won't need that administrator( person knowing ID/PSWD) to enter ID/PSWD for you again and again for each databases.
At Framework manager you can not just right click the Data sources Folder and create a new datasources.You will need to run MetaSata Wizard to get to that place from where either you can bring a existing datasource into your model or create a new datasouce.You just click on namespace and then goto to ACTION menu and click MetaData Wizard. From here procedure is same as you create a datasource from Cognos Connection.
Create Data Source and Data Source Connections


Create Data Source and Data Source Connections
The DB2 database name that you type must use uppercase letters. Also, in Framework Manager, the schema names that you type for the DB2 data sources must use uppercase letters.
The DB2 database name that you type must use uppercase letters. Also, in Framework Manager, the schema names that you type for the DB2 data sources must use uppercase letters.
Here we are creating a Data Source now -
1) Clicked on pink color icon
2) A screen comes, give datasource name and clik next , following screen appears
3) Select the database that you want to connect to and click next , following screen will appear.
You just need to give database name and ID and Password then you can test the connection.
Connection string will get automatically build by the cognos.
Here you can click on finish button and your datasouce is ready to be used in FM/Report Studio.
Disable drill down at particular level
You want to allow drill up on that level you need to do following
goto
1) Data - Drill Behaviour - select that particular level, both in drill up and drill down section.
Goto Advanced tab and for that particular level ; Define drill up behaviour as "Depth based Expression" and
Drill down behaviour as "Preserve".
This will enable drill up and disable drill down for that particular level.
2) Data - Drill Behaviour - Select that particular level and set the depth based expression to for example 2, that column or hierarchy will drill only till level 2.
Conditional Layouts
I didn't know about conditonal layouts until somebody asked me about it. I was not able to answer him and that was frustrating.
I know we work in technology field and there is every possibility that your work may not match with others work even if you both are working in say Cognos. Your insights and knowledge may be different from others who work in Cognos.
I wanted to know about conditional layouts but didn't find anything on net. I had to dig in report studio itself and find what it is.
When I came to know what it is , first word I uttered was "ABSURD !!!" .This is nothing but rendering !!!! We do more complex things and sometime we miss simple and easy things ,it also depends upon what kind of requirements your clients is presenting.If you keep working in XYZ area in Cognos , even if you have 10 years of experince you won't be able to answer the questions related to ABC area asked by 1 year experienced person in ABC.
But thats what I also like about technology ,everybody is having something to teach other person !!!!!
So now come back to Conditional layouts. These are the report layouts based on some condition.
For example client may run report in HTML or Excel or PDF. But if client doesn't want to include some columns in PDF version and add few more column in Excel version that what would you do ??? This is where conditional layouts are used.
Time Dimension Design from Cognos Perspective
Cognos do provide tecgniques like determinants at FM level to avoid double counting, but we cognos guys should make sure we don't reach to that level if possible.
The best is to flatten the hierarchy, most of the time we face this issue in time dimension but if we can flatten by not having surrogate key for month level and only have it for day level, we will be good. Directly join month level fact with this day level surrogate key...
Calculated Measures
Cognos developers are sometimes confused about calculated measures. The one thing they understand is that, it is called a calculated measure because we put somekind of calculation into it.
There is one more meaning of the calculated measure which helps in using it in more better manner,Calculated measure calculates itself depending upon where it is placed in Lists/Crosstabs.
You can say Calculated Measure is more dynamic in nature than other measures.
This definition gave me clear understanding of it and helped me use it in better way in reports. I hope it helps you as well.
|
Cross Product Confusion
The following property that we have , it doesn't mean that we will have cross join only after making this property 'Allow'.
By default its value is 'Deny".
We can always have cross-joins between the queries or we can make some kind of arrangements between the qureries and have cross-join and get our job done. This property stands for stopping any kind of cross-join between DATABASE TABLES.
Stitched query, star schema grouping and cognos FM
Many a times instead of using cognos own automatic functionalities , seen people using star schema groupings.
Start schema groupings are mainly used when you want to present clean picture of query subjects to the user so that they don't mix business subjects in the report.
It should not be used when you are having multiple facts in design as multiple facts will be taken care automatically when cardenilities are set 1-n between facts and dimensions. FM will automatically resolve multiple paths via stitched queries.
Joins at which layer ??
1) Where to define joins in FM layers, few says at database layer and few says at business layer.
Let us see where to do what -
a) data layer - making join at the data base layer makes more sense when you are modelling a relational data so
that you only get those tables in the query which you really are using. This is called minimized query.
b) business layer - if you define joins here or I say if you don't define joins in the data layer then your data
layer is free, on other layers you can redifne joins when need arise.
Many a times instead of using cognos own automatic functionalities , seen people using star schema groupings.
Start schema groupings are mainly used when you want to present clean picture of query subjects to the user so that they don't mix business subjects in the report.
It should not be used when you are having multiple facts in design as multiple facts will be taken care automatically when cardenilities are set 1-n between facts and dimensions. FM will automatically resolve multiple paths via stitched queries.
Joins at which layer ??
1) Where to define joins in FM layers, few says at database layer and few says at business layer.
Let us see where to do what -
a) data layer - making join at the data base layer makes more sense when you are modelling a relational data so
that you only get those tables in the query which you really are using. This is called minimized query.
b) business layer - if you define joins here or I say if you don't define joins in the data layer then your data
layer is free, on other layers you can redifne joins when need arise.
Dynamic datasource selection - Report Studio Report

Settings at the Framework Manager
 See the prompt and prompt static value which shows the data source that you have for selection. Name of the parameter should be same as given at FM level.
Cognos: to_char functionality without using to_char
Some times to_char function may not work in cognos to change the date format into required format
for example cognos by default shows the oracle date into yyyy-mm-dd format by I need to show the date in mm-dd-yyyy format. for that use the below expression..
CASE
WHEN EXTRACT(MONTH, [Date Field]) < 10
THEN
'0' ||
CAST(EXTRACT(MONTH, [Date Field]),VARCHAR(1))
ELSE
CAST(EXTRACT(MONTH, [Date Field]),VARCHAR(2))
END
|| '-' ||
CASE
WHEN EXTRACT(DAY, [Date Field]) < 10
THEN
'0' ||
CAST(EXTRACT(DAY, [Date Field]),VARCHAR(1))
ELSE
CAST(EXTRACT(DAY, [Date Field]),VARCHAR(2))
END
|| '-' ||
CAST(EXTRACT(YEAR, [Date Field]),VARCHAR(4))

Settings at the Framework Manager

Cognos: to_char functionality without using to_char
Some times to_char function may not work in cognos to change the date format into required format
for example cognos by default shows the oracle date into yyyy-mm-dd format by I need to show the date in mm-dd-yyyy format. for that use the below expression..
CASE
WHEN EXTRACT(MONTH, [Date Field]) < 10
THEN
'0' ||
CAST(EXTRACT(MONTH, [Date Field]),VARCHAR(1))
ELSE
CAST(EXTRACT(MONTH, [Date Field]),VARCHAR(2))
END
|| '-' ||
CASE
WHEN EXTRACT(DAY, [Date Field]) < 10
THEN
'0' ||
CAST(EXTRACT(DAY, [Date Field]),VARCHAR(1))
ELSE
CAST(EXTRACT(DAY, [Date Field]),VARCHAR(2))
END
|| '-' ||
CAST(EXTRACT(YEAR, [Date Field]),VARCHAR(4))
Auto Correct option in Report Studio
 I came across this option in the Tools menu of Report Studio and found it really useful.
When you run into validation errors while working on complex reports that involve a lot of data items and query objects, identifying the data item that is causing the error becomes difficult especially if its a complex syntax that is used across the data items. In such cases click on the Auto Correct option under Tools Menu to quickly identify all data items that have errors. This is much easier than going through the validation errors and trying to figure out the data items that have issues. But do not click on the OK button of the dialog box as this would remove the erroneous data items from the report.
Lets say we have a report that displays Product Line, Revenue, Margin, Quantity. Now the requirement is to display the values in the records only if quantity is more than 10000 else the records should display NA. So we include a case statement in all the metrics as "Case when [Sales(query)].[Sales].[Quantity] > 10000 then..". Now lets assume we made a mistake while copy-pasting this expression across the data items.Validating the report would throw the following error:
Case Statement Issues in 8.4 with Dimensional Model
This particular issue deals with Coercion errors. Your report works fine in 8.1 and when you have converted it to 8.4.1 you get an error that looks similar to the following:
QE-DEF-0478 Invalid coercion from 'value' to 'measure' for 'when ?Measure? = 'R' then [Revenue] when ?Measure? = 'Q' then
[Quantity] ' in 'case when ?Measure? = 'R' then [Revenue] when ?Measure? = 'Q' then [Quantity] end'.
This is due to the usage of Case statements against dimensional models. Cognos had earlier warned against usage of this against Dimensional Models now they seem to have started restricting the same.
Try using an If Then Else to work around this. But Cognos definitely needs to come up with a similar construct for Dimensional Models as well as most work revolves around the usage of Case statements.
Cognos: Saving Reports to a Local Directory
This topic has been covered in Cognos Docs. But thought would explain in simple terms and include images for the benefit of others.
Step 1: In Cognos Configuration, Click on Actions menu. Select "Edit Global Configuration" in Actions menu. Choose General Tab.

Step 2: Enter file system path in "Archive Location File System Root" property. Example: file://\\c:\ReportOutput. This will serve as the root file system. You can create sub-folders inside this root folder to hold the report outputs for each individual project. Save the changes and re-start the Cognos Server.
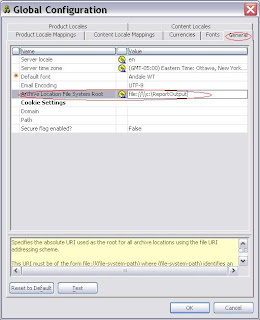
Step 3: In Cognos Connection, Launch IBM Cognos Connection and select Configuration tab. Choose Dispatchers and Services option.

Step 4: Click on Define File System Locations icon. Click New. Provide a Name. In the file system location text box enter the sub-folder name. Example: Project 1 and click Finish.

And here is a contribution from RoadwarriorPB. A big thanks to RoadWarriorPB for sharing the below information -
RoadwarriorPB -
In Step 5, you can define any number of File System locations. These definitions are nothing more than 'objects' in the Cognos Content Store, and can be secured like any other object. This can be very beneficial in a hosted, SaaS environment..you can define one 'location' per tenant,and secure the location for the Group associated with the tenant. Users will only 'see' the location they have rights to use.
The file system location is 'local' or relative to the Cognos Content Manager service, not the Report Dispatchers. If you have one or more Standby Content Managers, you will want to define network shares mapped to the same physical location for every Content Manager to insure that all Content Managers utilize the same physical file system location for output.
And here is a contribution from Nicolas. A big thanks to Nicolas for sharing the below information -
Nicolas -
This setting ("Save report outputs to a file system?") is used with the Content Manager advanced option "CM.OUTPUTFOLDER" which exports ALL executed reports to a designated folder (check the description provided by Cognos Configuration for that particular option). This was an old and rudimentary way for Cognos to handle output to file system, and later Cognos provided an Output Processor which handled this a little bit better.
Use Singleton to display data when there is no data in Report Page Query
In a report that was migrated from Cognos 8.2 to Cognos 8.3, I noticed that when there was no data in the report page, there was no data getting displayed for other queries in my report page. I have 2 queries being used in the report page - one for the main list report and another to return the user name using a macro. Now when no data was returned by the main query my user name was also not getting displayed. The user name was being displayed by a list with no borders and formatted to look like a singleton object as this was developed using 8.2. Now to rectify this I used a singleton object instead of the list and it worked fine.
List vs Chart
I have just finished delivering a set of Cognos reports for UAT and am awaiting for the results ;-)..So in the meantime thought I would post about some issues that I faced while creating the reports. You are welcome to post your thoughts on the same..
Have you ever noticed that a list report and a chart report behave differently when it comes to querying. I found that out fairly recently. Let me give you an example of how differently the two work. Assume you are to display for each selected Month the Top Products by Sales along with the monthly % contribution towards the sales. Ideally you would drag Product, Month, Sales, Rank(Sales for Month), Total(Sales for Month) - This is the total sales for the top products, % Contribution being - Sales / Total (Sales for Month) - basically how much did this Product contribution towards the total sales. I have a rank filter - rank < = 5 with after auto aggregation property set.
Now when I drag Product, Month, and % Contribution into my Chart report and List report, I see that the values are different. The list report displays the expected value while the chart report doesn't. On closer look I notice that the chart report doesn't apply the rank prior to the calculation of Total (Sales for Month). This means that my chart is calculating the total sales across all products for the month rather than Total sales for the Top 5 products.
Now that is weird when the List and chart behave differently. To work around this, I had to create a subquery which gets me the Product, Month, Sales and Rank with filter Rank < = 5. On top of this query I have another query that does the % contribution calculation. Now the list and chart work perfectly.
In retrospection I think the chart was working as expected, the rank filter was getting applied after aggregation. It was the list that wasn't working fine even though it returned the data I required.
The point though that I would like to make here is that not always lists and charts work the same way or fire the same query.
Avoiding Meta data Callbacks due to Hard-Coded SQLs
You would probably have noticed that Cognos creates meta data call-backs when you have reports based on Query Subjects that have SQLs hard-coded in them. To avoid such call-backs, import all the tables referenced by your query and leave them untouched. Cognos will reference the meta data from these tables while generating the SQL hard-coded in the query subject.
I would suggest it best to avoid hard-coding SQLs in query subjects but instead to create them as views in the DB and reference them through Cognos. This would help ensure better maintenance of objects and in easier impact-analysis of DB changes. Hard-Coded SQLs in query subjects should only be used when dynamicity is required through the usage of Cognos macros in the queries.
Macro Prompts in FM Model for Adhoc Packages
Working on creating an Adhoc Package for use in Query Studio. The package needs to include base metrics and compound metrics and users need to be prompted for Date range and other Dimensions on pulling any of the metrics.
For the prompts, I included filters in the model query subject and built of the metrics. But what I noticed was that, only the base metrics prompt the users and if you drag a compound metric you are not prompted the first time in Query Studio until you hit the re-run button.
Work-around is to use macro filters rather than ?parameter? filters.
Multiple Queries for different data containers
Why does Cognos generate Multiple Queries even when you have the different objects pointed to the same Query?
Now before I answer that, here's a tip to all the newbies on seeing the SQLs generated by Cognos. To identify the SQLs that Cognos fires against the DB, you would need to use the Generated SQL/MDX option from the Tools Menu and not the one available for each individual Query Object in Cognos. This will display the various SQLs that Cognos would fire against the DB and here's where you would notice that even if you have multiple objects pointing to the same Query Object, Cognos would still fire multiple queries.
Now if you have say multiple lists all pointing to the same Query Object, then unless the columns pulled in, the sort order, group by clauses match, Cognos would fire multiple queries. To make the columns pulled in to match you could use the Properties property of the lists and select all those columns that are missing from each list to match the other lists based out of the same Query Subject.
In case you have different data containers say like a list and crosstab or a bar graph and crosstab pointing to the same query subject Cognos would fire multiple queries as that's how its designed. So no luck over there.
This topic has been covered in Cognos Docs. But thought would explain in simple terms and include images for the benefit of others.
Step 1: In Cognos Configuration, Click on Actions menu. Select "Edit Global Configuration" in Actions menu. Choose General Tab.
Step 2: Enter file system path in "Archive Location File System Root" property. Example: file://\\c:\ReportOutput. This will serve as the root file system. You can create sub-folders inside this root folder to hold the report outputs for each individual project. Save the changes and re-start the Cognos Server.
Step 3: In Cognos Connection, Launch IBM Cognos Connection and select Configuration tab. Choose Dispatchers and Services option.
Step 4: Click on Define File System Locations icon. Click New. Provide a Name. In the file system location text box enter the sub-folder name. Example: Project 1 and click Finish.
And here is a contribution from RoadwarriorPB. A big thanks to RoadWarriorPB for sharing the below information -
RoadwarriorPB -
In Step 5, you can define any number of File System locations. These definitions are nothing more than 'objects' in the Cognos Content Store, and can be secured like any other object. This can be very beneficial in a hosted, SaaS environment..you can define one 'location' per tenant,and secure the location for the Group associated with the tenant. Users will only 'see' the location they have rights to use.
The file system location is 'local' or relative to the Cognos Content Manager service, not the Report Dispatchers. If you have one or more Standby Content Managers, you will want to define network shares mapped to the same physical location for every Content Manager to insure that all Content Managers utilize the same physical file system location for output.
And here is a contribution from Nicolas. A big thanks to Nicolas for sharing the below information -
Nicolas -
This setting ("Save report outputs to a file system?") is used with the Content Manager advanced option "CM.OUTPUTFOLDER" which exports ALL executed reports to a designated folder (check the description provided by Cognos Configuration for that particular option). This was an old and rudimentary way for Cognos to handle output to file system, and later Cognos provided an Output Processor which handled this a little bit better.
Use Singleton to display data when there is no data in Report Page Query
In a report that was migrated from Cognos 8.2 to Cognos 8.3, I noticed that when there was no data in the report page, there was no data getting displayed for other queries in my report page. I have 2 queries being used in the report page - one for the main list report and another to return the user name using a macro. Now when no data was returned by the main query my user name was also not getting displayed. The user name was being displayed by a list with no borders and formatted to look like a singleton object as this was developed using 8.2. Now to rectify this I used a singleton object instead of the list and it worked fine.
List vs Chart
I have just finished delivering a set of Cognos reports for UAT and am awaiting for the results ;-)..So in the meantime thought I would post about some issues that I faced while creating the reports. You are welcome to post your thoughts on the same..
Have you ever noticed that a list report and a chart report behave differently when it comes to querying. I found that out fairly recently. Let me give you an example of how differently the two work. Assume you are to display for each selected Month the Top Products by Sales along with the monthly % contribution towards the sales. Ideally you would drag Product, Month, Sales, Rank(Sales for Month), Total(Sales for Month) - This is the total sales for the top products, % Contribution being - Sales / Total (Sales for Month) - basically how much did this Product contribution towards the total sales. I have a rank filter - rank < = 5 with after auto aggregation property set.
Now when I drag Product, Month, and % Contribution into my Chart report and List report, I see that the values are different. The list report displays the expected value while the chart report doesn't. On closer look I notice that the chart report doesn't apply the rank prior to the calculation of Total (Sales for Month). This means that my chart is calculating the total sales across all products for the month rather than Total sales for the Top 5 products.
Now that is weird when the List and chart behave differently. To work around this, I had to create a subquery which gets me the Product, Month, Sales and Rank with filter Rank < = 5. On top of this query I have another query that does the % contribution calculation. Now the list and chart work perfectly.
In retrospection I think the chart was working as expected, the rank filter was getting applied after aggregation. It was the list that wasn't working fine even though it returned the data I required.
The point though that I would like to make here is that not always lists and charts work the same way or fire the same query.
You would probably have noticed that Cognos creates meta data call-backs when you have reports based on Query Subjects that have SQLs hard-coded in them. To avoid such call-backs, import all the tables referenced by your query and leave them untouched. Cognos will reference the meta data from these tables while generating the SQL hard-coded in the query subject.
I would suggest it best to avoid hard-coding SQLs in query subjects but instead to create them as views in the DB and reference them through Cognos. This would help ensure better maintenance of objects and in easier impact-analysis of DB changes. Hard-Coded SQLs in query subjects should only be used when dynamicity is required through the usage of Cognos macros in the queries.
Macro Prompts in FM Model for Adhoc Packages
Working on creating an Adhoc Package for use in Query Studio. The package needs to include base metrics and compound metrics and users need to be prompted for Date range and other Dimensions on pulling any of the metrics.
For the prompts, I included filters in the model query subject and built of the metrics. But what I noticed was that, only the base metrics prompt the users and if you drag a compound metric you are not prompted the first time in Query Studio until you hit the re-run button.
Work-around is to use macro filters rather than ?parameter? filters.
Multiple Queries for different data containers
Why does Cognos generate Multiple Queries even when you have the different objects pointed to the same Query?
Now before I answer that, here's a tip to all the newbies on seeing the SQLs generated by Cognos. To identify the SQLs that Cognos fires against the DB, you would need to use the Generated SQL/MDX option from the Tools Menu and not the one available for each individual Query Object in Cognos. This will display the various SQLs that Cognos would fire against the DB and here's where you would notice that even if you have multiple objects pointing to the same Query Object, Cognos would still fire multiple queries.
Now if you have say multiple lists all pointing to the same Query Object, then unless the columns pulled in, the sort order, group by clauses match, Cognos would fire multiple queries. To make the columns pulled in to match you could use the Properties property of the lists and select all those columns that are missing from each list to match the other lists based out of the same Query Subject.
In case you have different data containers say like a list and crosstab or a bar graph and crosstab pointing to the same query subject Cognos would fire multiple queries as that's how its designed. So no luck over there.
Report Studio: User Query - Display Totals for Top 2 Ranks while displaying data for all other ranks in a crosstab?
This is in response to a user query.
Requirement: Display Ranks across Columns in a Crosstab and the Total column needs to include only the Top 2 ranks along with Overall Total column for all Ranks.
Solution:
Step 1: Create the base query Query 1 with the following data items: Product, Year, Sales, Rnk, Top 2 Sales Total.
Rnk - Rank([Sales] for [Product])
Top 3 Sales Total - case when [Rnk] < 3 then [Sales] end
Step 2: Create the outer query Query 2 by referencing the base query Query 1. Drag the data items - Product, Year, Sales, Rnk, Top 2 Sales Total from the referenced query.
Step 3: Set the aggregate function of Rnk to None.
Step 4: Create the crosstab by dragging in the data items Product, Sales, Top 2 Sales Total from Query 2.
Step 5: Create the Overall Total column by clicking on the Summary button for Rank column.


Importing Objects from FM into Other FM Models - Drawbacks
There are so many issues when trying to use this feature provided by Cognos. For a simple activity I tried importing 2 Data Source Query Subjects from Physical Layer of Model A into Test Layer of Model B. But the objects got imported into Physical Layer of Model A. To add on to my woes, it also imported a whole lot of other objects that had no dependency on the imported Query Subjects. These objects were Functions. So don't know if this has to do only with functions.
Another issue I found with this approach is that relationships between imported objects also get imported. And unlike Data Source based imports where users are prompted to choose to either create relationships or not, in case of model based imports this option is not provided requiring me to manually look up the imported objects and clean out those not required.
Copies of source model packages were also created which may be because the imported objects are part of the source model packages.
This is a powerful feature when you want to save time by re-using objects designed in other models but with all the issues listed out above, it seems to be a painful feature to use for the time being, until Cognos fixes these bugs. What can make this feature easier to use apart from fixing of the bugs would be options to select the kind of objects to import like 'relationships', 'calculations' etc. that may be dependent on the imported objects rather than having Cognos import all such dependent objects.
Deleting Report Output Versions
The easiest way to deleting report output versions across reports would be to re-export and re-import the reports and unchecking the Include Report versions property while creating the export. This then deletes all report output versions that have so far been created in your production environment for the reports imported. But this works only for Public Folders reports. To delete report output versions created in users My Folders or to delete all report output versions except the last x versions you would need to use SDK.
Using Text Wrap property instead of setting Widths
A lot of beginners in Cognos try to set list column widths to fit data to avoid text wrapping rather than using the White Space property. This is probably because the property name is misleading.
So to all those beginners who didn't know, set the White Space property of a list column to No Wrap instead of trying to set fixed widths if the intention is to avoid the data displayed in the column from wrapping.
This is in response to a user query.
Requirement: Display Ranks across Columns in a Crosstab and the Total column needs to include only the Top 2 ranks along with Overall Total column for all Ranks.
Solution:
Step 1: Create the base query Query 1 with the following data items: Product, Year, Sales, Rnk, Top 2 Sales Total.
Step 2: Create the outer query Query 2 by referencing the base query Query 1. Drag the data items - Product, Year, Sales, Rnk, Top 2 Sales Total from the referenced query.
Step 3: Set the aggregate function of Rnk to None.
Step 4: Create the crosstab by dragging in the data items Product, Sales, Top 2 Sales Total from Query 2.
Step 5: Create the Overall Total column by clicking on the Summary button for Rank column.
Requirement: Display Ranks across Columns in a Crosstab and the Total column needs to include only the Top 2 ranks along with Overall Total column for all Ranks.
Solution:
Step 1: Create the base query Query 1 with the following data items: Product, Year, Sales, Rnk, Top 2 Sales Total.
Rnk - Rank([Sales] for [Product])
Top 3 Sales Total - case when [Rnk] < 3 then [Sales] end
Step 2: Create the outer query Query 2 by referencing the base query Query 1. Drag the data items - Product, Year, Sales, Rnk, Top 2 Sales Total from the referenced query.
Step 3: Set the aggregate function of Rnk to None.
Step 4: Create the crosstab by dragging in the data items Product, Sales, Top 2 Sales Total from Query 2.
Step 5: Create the Overall Total column by clicking on the Summary button for Rank column.


Importing Objects from FM into Other FM Models - Drawbacks
There are so many issues when trying to use this feature provided by Cognos. For a simple activity I tried importing 2 Data Source Query Subjects from Physical Layer of Model A into Test Layer of Model B. But the objects got imported into Physical Layer of Model A. To add on to my woes, it also imported a whole lot of other objects that had no dependency on the imported Query Subjects. These objects were Functions. So don't know if this has to do only with functions.
Another issue I found with this approach is that relationships between imported objects also get imported. And unlike Data Source based imports where users are prompted to choose to either create relationships or not, in case of model based imports this option is not provided requiring me to manually look up the imported objects and clean out those not required.
Copies of source model packages were also created which may be because the imported objects are part of the source model packages.
This is a powerful feature when you want to save time by re-using objects designed in other models but with all the issues listed out above, it seems to be a painful feature to use for the time being, until Cognos fixes these bugs. What can make this feature easier to use apart from fixing of the bugs would be options to select the kind of objects to import like 'relationships', 'calculations' etc. that may be dependent on the imported objects rather than having Cognos import all such dependent objects.
Deleting Report Output Versions
The easiest way to deleting report output versions across reports would be to re-export and re-import the reports and unchecking the Include Report versions property while creating the export. This then deletes all report output versions that have so far been created in your production environment for the reports imported. But this works only for Public Folders reports. To delete report output versions created in users My Folders or to delete all report output versions except the last x versions you would need to use SDK.
Using Text Wrap property instead of setting Widths
A lot of beginners in Cognos try to set list column widths to fit data to avoid text wrapping rather than using the White Space property. This is probably because the property name is misleading.
So to all those beginners who didn't know, set the White Space property of a list column to No Wrap instead of trying to set fixed widths if the intention is to avoid the data displayed in the column from wrapping.
Defect - Duplicate Queries generated by Cognos
I seem to be on a ride running into numerous defects over the last couple of months. The latest one being similar duplicate queries generated by Cognos in a particular scenario.
As can be seen from the screenshot, Cognos generates 2 queries with no differences and both having the same name.

This happens in the below scenario:
When you have a singleton object before all other Objects in the report.
And when you have Prompt Macro as the first filter in the first object of the report.
And if you have value prompts after the singleton but before the first chart/list/crosstab object, then these queries get duplicated as shown below:
When each query counts towards performance, this isn't good.
Adding Comments to Saved Report Output Versions
I seem to be on a ride running into numerous defects over the last couple of months. The latest one being similar duplicate queries generated by Cognos in a particular scenario.
As can be seen from the screenshot, Cognos generates 2 queries with no differences and both having the same name.
This happens in the below scenario:
When you have a singleton object before all other Objects in the report.
And when you have Prompt Macro as the first filter in the first object of the report.
And if you have value prompts after the singleton but before the first chart/list/crosstab object, then these queries get duplicated as shown below:
When each query counts towards performance, this isn't good.
As can be seen from the screenshot, Cognos generates 2 queries with no differences and both having the same name.

When you have a singleton object before all other Objects in the report.
And when you have Prompt Macro as the first filter in the first object of the report.
And if you have value prompts after the singleton but before the first chart/list/crosstab object, then these queries get duplicated as shown below:
Adding Comments to Saved Report Output Versions
This is a new feature that I came across in Cognos 8.4. This is not to be confused with adding comments on on-demand/interactive run reports that developers keep asking for (this feature is available with Cognos 10 though).
Requirement: Create a Sales report and schedule it to run once every month and save the output to Cognos Directory with a burst label identifying the month the report was executed for. Allow users to add comments to the burst output.
Step 1: Create the required report (not going into the details of this unless someone wants me to).
Step 2: From Cognos Connection, select the "Set Properties" action. On the report tab, click on Advanced options and check the "Enable comments in saved output versions" option.

Step 3: Burst the report.
Step 4: Open the report output version, notice the "Add Comments" icon at the far right-end of the screen.

Step 5: Set comments and close the report output version.

Step 6: Re-open the report output version, notice the comment added earlier.

This is a new feature that I came across in Cognos 8.4. This is not to be confused with adding comments on on-demand/interactive run reports that developers keep asking for (this feature is available with Cognos 10 though).
Requirement: Create a Sales report and schedule it to run once every month and save the output to Cognos Directory with a burst label identifying the month the report was executed for. Allow users to add comments to the burst output.
Step 1: Create the required report (not going into the details of this unless someone wants me to).
Step 2: From Cognos Connection, select the "Set Properties" action. On the report tab, click on Advanced options and check the "Enable comments in saved output versions" option.
Step 3: Burst the report.
Step 4: Open the report output version, notice the "Add Comments" icon at the far right-end of the screen.
Step 5: Set comments and close the report output version.
Step 6: Re-open the report output version, notice the comment added earlier.
Requirement: Create a Sales report and schedule it to run once every month and save the output to Cognos Directory with a burst label identifying the month the report was executed for. Allow users to add comments to the burst output.
Step 1: Create the required report (not going into the details of this unless someone wants me to).
Step 2: From Cognos Connection, select the "Set Properties" action. On the report tab, click on Advanced options and check the "Enable comments in saved output versions" option.

Step 3: Burst the report.

Step 4: Open the report output version, notice the "Add Comments" icon at the far right-end of the screen.

Step 5: Set comments and close the report output version.

Step 6: Re-open the report output version, notice the comment added earlier.

Cognos 10 - Scheduling Features
Came across an IBM Supportlink article mentioning a new scheduling feature available with Cognos 10 that I think is really helpful.
There are many times when you wish to schedule your report to run once every x hours but on certain days in the week and only between certain time range on those days. This was so far not possible up until Cognos 10. Cognos objects could only be scheduled to run once every x hours or only once on certain days of the week, a combination of hours on week days was not possible.
With Cognos 10, users can now schedule their reports to run once every x hours on certain days of the week between certain time range on those days. You can read up more on this on IBM support link article.
Remap to New Source in FM ( Update latest changes)
Very recently found this option really handy in FM. This option is real useful when you have a model already built and at a later date there are changes to the tables being used with the possibility of an existing table getting dropped and the information being made available in another table or in a new table.
Dropping a data source query subject would invalidate your business layer and in earlier versions of Cognos this would result in re-designing and re-developing certain sections of the model. This has now been made easy with the "Remap to new source" option available on model query subjects. With this option you can remap individual columns in a model query subject to other columns in your physical layer.
You can also remap multiple columns at one go by setting options to match columns from the source to target and then drag all columns from the data source query subject to the model query subject and Cognos will automatically remap the various columns based on the options set. This is useful when your query subjects contain a huge number of columns.

Avoid Paginating Saved HTML Outputs
When you burst/save HTML outputs, you must have noticed that Cognos by default paginates the outputs with the default value being 20 rows per page. In saved outputs, this causes sections of the report to repeat down the length of the single HTML page. This can be avoided by setting the rows per page property for report objects.
However, you can also set "Paginate saved HTML output" available under File Menu > Report Properties to achieve the same. This property saves users from having to set a very high value for the Rows Per Page property against each report object.
However, you can also set "Paginate saved HTML output" available under File Menu > Report Properties to achieve the same. This property saves users from having to set a very high value for the Rows Per Page property against each report object.

Chart Conditional Measures - Conditional Legend
When you create a chart based report that accepts multiple measures as input using case statements the legend is displayed for all the series and not just for the measures selected. To avoid this, disable the chart provided legend and create a manual legend next to the chart and use the colors set in the chart palette to display the right colors for the right series.


When you create a chart based report that accepts multiple measures as input using case statements the legend is displayed for all the series and not just for the measures selected. To avoid this, disable the chart provided legend and create a manual legend next to the chart and use the colors set in the chart palette to display the right colors for the right series.


Report Studio : Scrollable Lists
Requirement: Display a Prompts Pane and a List Pane. The list should display all rows in a single page with the capability to scroll. Note: the Prompts pane should remain visible to the users while scrolling down.
The simplest way to achieve the above requirement would be to use CSS. The advantage of providing scroll bars as part of the list is you can have other objects on the page still in user's visibility.
Solution:
Step 1: Create a table with 2 columns. Add the required Prompts to Column 1 and the list object to Column 2. Set the height for the table cell in which you would like to place the scrollable list.
Step 2: Insert HTML items as shown below:


HTML 1: < div style="height: 100%; overflow: auto;" >
HTML 2: </div>
Requirement: Display a Prompts Pane and a List Pane. The list should display all rows in a single page with the capability to scroll. Note: the Prompts pane should remain visible to the users while scrolling down.
The simplest way to achieve the above requirement would be to use CSS. The advantage of providing scroll bars as part of the list is you can have other objects on the page still in user's visibility.
Solution:
Step 1: Create a table with 2 columns. Add the required Prompts to Column 1 and the list object to Column 2. Set the height for the table cell in which you would like to place the scrollable list.
Step 2: Insert HTML items as shown below:
HTML 1: < div style="height: 100%; overflow: auto;" >
HTML 2: </div>
The simplest way to achieve the above requirement would be to use CSS. The advantage of providing scroll bars as part of the list is you can have other objects on the page still in user's visibility.
Solution:
Step 1: Create a table with 2 columns. Add the required Prompts to Column 1 and the list object to Column 2. Set the height for the table cell in which you would like to place the scrollable list.
Step 2: Insert HTML items as shown below:


HTML 1: < div style="height: 100%; overflow: auto;" >
HTML 2: </div>
User Query - Creating Overall Percentage Summary Values in Reports
This requirement is in response to a user query:
Requirement: Display Dates, Sales, Percentage Sales along with summary total.
Solution:
Step 1: Create a crosstab report with Year, Month, Sales data items.
Step 2: Create a data item Total Sales - total(...[Sales] for report).
Step 3: Set the Aggregate and Rollup Aggregate functions to calculated.
Step 4: Create a data item Percentage - [Sales] / [Total Sales] and set aggregate and rollup to calculated. Drag this query item into the crosstab.
 Here are a couple of other ways to format the above information:
This requirement is in response to a user query:
Requirement: Display Dates, Sales, Percentage Sales along with summary total.
Solution:
Step 1: Create a crosstab report with Year, Month, Sales data items.
Step 2: Create a data item Total Sales - total(...[Sales] for report).
Step 3: Set the Aggregate and Rollup Aggregate functions to calculated.
Step 4: Create a data item Percentage - [Sales] / [Total Sales] and set aggregate and rollup to calculated. Drag this query item into the crosstab.
Here are a couple of other ways to format the above information:Requirement: Display Dates, Sales, Percentage Sales along with summary total.
Solution:
Step 1: Create a crosstab report with Year, Month, Sales data items.
Step 2: Create a data item Total Sales - total(...[Sales] for report).
Step 3: Set the Aggregate and Rollup Aggregate functions to calculated.
Step 4: Create a data item Percentage - [Sales] / [Total Sales] and set aggregate and rollup to calculated. Drag this query item into the crosstab.

Cognos 10 Prompts - New Features
As has been pointed out by Ziegenbart in his comments, with Cognos 10, you needn't use any Javascript to modify the value prompt title line. Cognos 10 provides properties through which you can control the first 2 lines of the prompts.

User Contribution [Ziegenbart]:
I've been using the properties of the value prompt itself to either customize or remove the header text. Super simple and no need to use javascript with the disclaimer that there is no guarantee it will work or won't break. (I'm using Cognos 10 btw).
The default selection for the "Header Text" under "Prompt Text" for the value prompt is "Automatic".
Click on the ellipsis to the right of "Automatic" in the "Header Text" property. Change the selection to "Specified text" and leave the text field empty.
The first two lines of the Value Prompt are now removed.
You can also use this to customize what the first line says to meet business needs by entering some text (e.g. "Please make selection")
You can manipulate many of the presentation elements of a value prompt using the properties menu.
COGNOS: Add a Multimedia File to a Report
Place your Video ( .wmv or .avi format) in the following path
C:\Program Files\ibm\cognos\c10\webcontent\samples\images\
Note: You must have Windows Media Player installed on your computer.
In the Insertable Objects pane, on the Toolbox tab, drag the HTML Item object to the report.
Select the HTML Item.
double-click the HTML Item
In the HTML dialog box, type the following:
<OBJECT classid="CLSID:6BF52A52-394A-11D3-B153-00C04F79FAA6"> <PARAM NAME="URL" VALUE="/c10/webcontent/samples/images/yourVideo.wmv"/> </OBJECT>
Filter a report based on comma separated values entered in a text box prompt
Create a text box prompt with parameter like 'p'
enter the filter expression in detail filter as follows:
cast(column name,varchar(200)) in ( #csv ( split(' ', split(',', split(' ,', split(' , ', split(', ', prompt('p','token') ) ) ) ) ) ) # )
Cognos Schedule report will be not delivered issue?
Some times Cognos sccheduled Report output attachment will not be delivered even the the output of the report is around 1.5 MB.
Resolution:
Check your mail server for incoming/outgoing attachment size limit
(you can't do it, ask your admins)
Cognos Schedule Issue
Some times Cognos Scheduled jobs may not run even though we do not either disable it or modify it.
The reason is,, if password is expired of the user whoever scheduled the job, then Cognos schedules stop working,
Resolution:
Very simple, The person who have scheduled the jobs has to login into the cognos once with new password and run the schedule manually once from Cognos administration.
Cognos Chart limitations in EXCEL
The following Cognos chart properties are not supported in EXCEL
1) Tool tips
2) Conditional Text
3) Depth, Visual angle
4) Show values
5) Marker Text location
6) Show baseline
7) n-degree rotation lables
8) border, Margin, box type
9) Font, subtitle, Include 0 for Auto scale
10) Scale
As has been pointed out by Ziegenbart in his comments, with Cognos 10, you needn't use any Javascript to modify the value prompt title line. Cognos 10 provides properties through which you can control the first 2 lines of the prompts.
User Contribution [Ziegenbart]:COGNOS: Add a Multimedia File to a Report
I've been using the properties of the value prompt itself to either customize or remove the header text. Super simple and no need to use javascript with the disclaimer that there is no guarantee it will work or won't break. (I'm using Cognos 10 btw).
The default selection for the "Header Text" under "Prompt Text" for the value prompt is "Automatic".
Click on the ellipsis to the right of "Automatic" in the "Header Text" property. Change the selection to "Specified text" and leave the text field empty.
The first two lines of the Value Prompt are now removed.
You can also use this to customize what the first line says to meet business needs by entering some text (e.g. "Please make selection")
You can manipulate many of the presentation elements of a value prompt using the properties menu.
Place your Video ( .wmv or .avi format) in the following path
C:\Program Files\ibm\cognos\c10\webcontent\samples\images\
Note: You must have Windows Media Player installed on your computer.
In the Insertable Objects pane, on the Toolbox tab, drag the HTML Item object to the report.
Select the HTML Item.
double-click the HTML Item
In the HTML dialog box, type the following:
<OBJECT classid="CLSID:6BF52A52-394A-11D3-B153-00C04F79FAA6"> <PARAM NAME="URL" VALUE="/c10/webcontent/samples/images/yourVideo.wmv"/> </OBJECT>
Create a text box prompt with parameter like 'p'
enter the filter expression in detail filter as follows:
cast(column name,varchar(200)) in ( #csv ( split(' ', split(',', split(' ,', split(' , ', split(', ', prompt('p','token') ) ) ) ) ) ) # )
Cognos Schedule report will be not delivered issue?
Some times Cognos sccheduled Report output attachment will not be delivered even the the output of the report is around 1.5 MB.
Resolution:
Check your mail server for incoming/outgoing attachment size limit
(you can't do it, ask your admins)
Cognos Schedule Issue
Some times Cognos Scheduled jobs may not run even though we do not either disable it or modify it.
The reason is,, if password is expired of the user whoever scheduled the job, then Cognos schedules stop working,
Resolution:
Very simple, The person who have scheduled the jobs has to login into the cognos once with new password and run the schedule manually once from Cognos administration.
Cognos Chart limitations in EXCEL
The following Cognos chart properties are not supported in EXCEL
1) Tool tips
2) Conditional Text
3) Depth, Visual angle
4) Show values
5) Marker Text location
6) Show baseline
7) n-degree rotation lables
8) border, Margin, box type
9) Font, subtitle, Include 0 for Auto scale
10) Scale
COGNOS: Difference between Two values in a COLUMN
Suppose I have report output as follows…

Now, I want to find difference between 2006’s Revenue and 2007’s Revenue in its footer…
To Resolve this follow the steps
1) Create a list report as follows

2) Create a Filter to only show 2006 and 2007 as follows
 3)
3)
 4) Select the summary row(The overall footer ) and split it
5) Unlock the report
6) Drag query calculation to the Cell as follows..
4) Select the summary row(The overall footer ) and split it
5) Unlock the report
6) Drag query calculation to the Cell as follows..
 7) Give any name and enter the following expression in Expression definition box..
 8) Click OK and Run the report, you will get output as follows..

COGNOS: CSV or Excel output limitatoins
When saving a report in Excel 2003, we can't save all the report output if the report output contains more than 65535 rows due to the limitation of Excel .
Excel 2007 limits : Worksheet size 1,048,576 rows by 16,384 columns
By default, .CSV files are opened in Excel, so even though .CSV files don't have the 65k row limitation, the file will be truncated if it is opened in Excel.
Resolving the problem
View the file as a CSV and change the format from Excel to a text file. Steps:
After generating the report in HTML format, select the toolbar button to View in CSV Format
Once the File Download dialogue appears?click Save and the Save As dialogue will appear
(Note: If you do not see a Save As dialogue, verify in Internet Explorer you have Automatic prompting for file download set to ENABLE under Tools -> Internet Options -> Security -> Custom level)
From the Save as Type list?change the format from Microsoft Excel Worksheet to All Files
Change the File Name from reportfile.xls to reportfile.txt and click Save
This will create a Tab-Delimited text file that can be used as a data source.
Suppose I have report output as follows…
Now, I want to find difference between 2006’s Revenue and 2007’s Revenue in its footer…
To Resolve this follow the steps
1) Create a list report as follows
2) Create a Filter to only show 2006 and 2007 as follows
3)
4) Select the summary row(The overall footer ) and split it
5) Unlock the report
6) Drag query calculation to the Cell as follows..

7) Give any name and enter the following expression in Expression definition box..

8) Click OK and Run the report, you will get output as follows..

COGNOS: CSV or Excel output limitatoins
When saving a report in Excel 2003, we can't save all the report output if the report output contains more than 65535 rows due to the limitation of Excel .
Excel 2007 limits : Worksheet size 1,048,576 rows by 16,384 columns
By default, .CSV files are opened in Excel, so even though .CSV files don't have the 65k row limitation, the file will be truncated if it is opened in Excel.
Resolving the problem
View the file as a CSV and change the format from Excel to a text file. Steps:
After generating the report in HTML format, select the toolbar button to View in CSV Format
Once the File Download dialogue appears?click Save and the Save As dialogue will appear
(Note: If you do not see a Save As dialogue, verify in Internet Explorer you have Automatic prompting for file download set to ENABLE under Tools -> Internet Options -> Security -> Custom level)
From the Save as Type list?change the format from Microsoft Excel Worksheet to All Files
Change the File Name from reportfile.xls to reportfile.txt and click Save
This will create a Tab-Delimited text file that can be used as a data source.
Fixing the Size of Select & Search Prompt Dynamic
By default, The width of Select & Search prompt is fixed and therefore wide text will cut off.....
 Note: The following Technique is only Applicable for Cognos 8.4 Fix Pack 2 and Higher..
STEPS:
1) Locate for a File properties.js in the location ...c8\webcontent\prompting (on the machine where you installed cognos 8 gateway)
2) Take a back of it ( This backup is useful to restore the file properties.js if any thing goes wrong)
3) Open the file with any Text editor and search for the line..
"SYSTEMPROPERTY_CSEARCH_AUTO_RESIZE_RESULT_LIST=FALSE"
4) Replace FALSE with TRUE
 5) Save the file
6) Launch the cognos and check the prompt you can see as follows..

By default, The width of Select & Search prompt is fixed and therefore wide text will cut off.....
Note: The following Technique is only Applicable for Cognos 8.4 Fix Pack 2 and Higher..
STEPS:
1) Locate for a File properties.js in the location ...c8\webcontent\prompting (on the machine where you installed cognos 8 gateway)
2) Take a back of it ( This backup is useful to restore the file properties.js if any thing goes wrong)
3) Open the file with any Text editor and search for the line..
"SYSTEMPROPERTY_CSEARCH_AUTO_RESIZE_RESULT_LIST=FALSE"
4) Replace FALSE with TRUE
5) Save the file
6) Launch the cognos and check the prompt you can see as follows..
STEPS:
1) Locate for a File properties.js in the location ...c8\webcontent\prompting (on the machine where you installed cognos 8 gateway)
2) Take a back of it ( This backup is useful to restore the file properties.js if any thing goes wrong)
3) Open the file with any Text editor and search for the line..
"SYSTEMPROPERTY_CSEARCH_AUTO_RESIZE_RESULT_LIST=FALSE"
4) Replace FALSE with TRUE

6) Launch the cognos and check the prompt you can see as follows..
Report Studio: Prompt Expressions between Relational and Dimensional Packages..
Prompt expressions use the following syntax, where p represents the parameter name.
Relational: Detail Filter
Dimensional: slicer expression or filter expressions
[data item] = ?p?
[level or hierarchy]->?p?
[data item] in ?p?
set([level or hierarchy]->?p?)
Prompt expressions use the following syntax, where p represents the parameter name.
You can also use these expressions to create parameterized data items.
Relational: Detail Filter
|
Dimensional: slicer expression or filter expressions
|
[data item] = ?p?
for single-select prompts
|
[level or hierarchy]->?p?
For single-select member prompts and master detail relationships
|
[data item] in ?p?
for multi-select prompts
|
set([level or hierarchy]->?p?)
For multi-select member prompts
|
ReplyDeleteThank you for sharing valuable information.
Microstrategy Online Training
Very nice article,thank you.
ReplyDeletecognos tm1 course